
Weekly Market Roundup
MG News | August 15, 2026 at 10:06 AM GMT+05:00

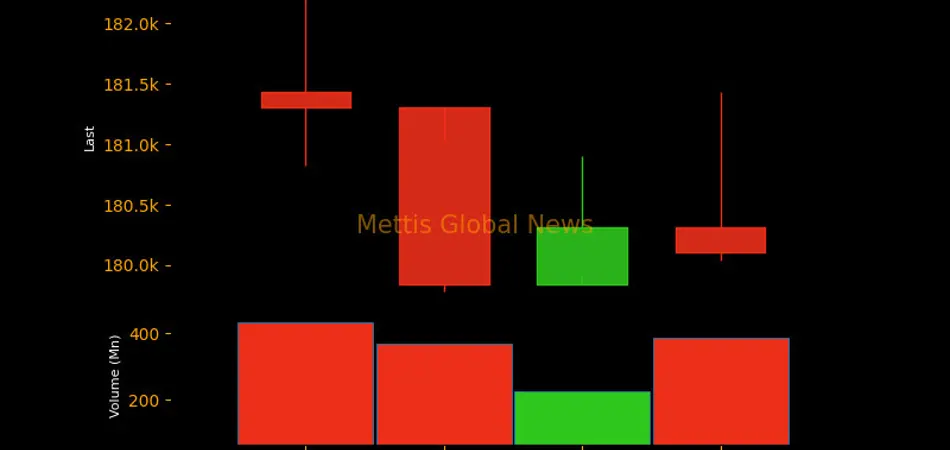
August 15, 2026 (MLN): The benchmark KSE-100 Index closed the week ended August 13, 2026, at 180,104.61 points, losing 1,325.41 points, or 0.73%, on a week-on-week basis from 181,430.02 points recorded on August 7, 2026.
sentiment remained subdued during the week amid heightened
geopolitical uncertainty and concerns over global energy supplies. Uncertainty
surrounding a potential US-Iran agreement, coupled with disruptions around the
Strait of Hormuz, kept investors cautious.
Rising oil prices, following fresh vessel attacks in the
Gulf of Oman and Red Sea, further weighed on market sentiment, while a major
oil spill off Oman added to concerns over supply disruptions._20260815050314546_158ee5.jpeg)
Market Capitalization
The Pakistan Stock Exchange's market capitalization
decreased by Rs57.05 billion during the week, falling from Rs5.154 trillion on
August 7 to Rs5.097tr on August 13.
In dollar terms, market capitalization declined from $18.56bn
to $18.36bn, registering a decrease of approximately $201.52 million over the
week._20260815050256340_c510cc.jpeg)
The market's USD-adjusted return stood at -0.71%, compared
with 3.06% in the previous week, reflecting the benchmark's decline after
accounting for currency movements.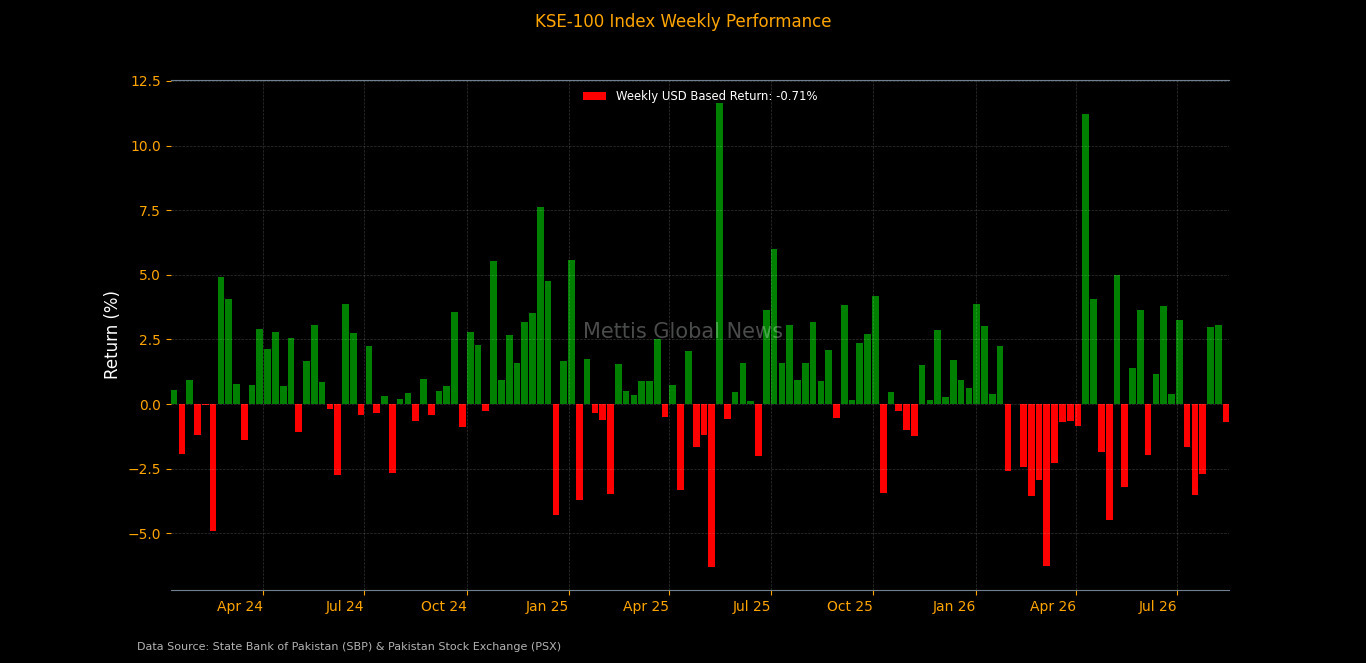
On the macroeconomic front, Pakistan’s
external debt and liabilities rose 1.41% QoQ and 2.37% YoY to $138.85
billion by end-Q4FY26.
Pakistan’s central
government debt rose 7.39% YoY and 2.06% MoM to Rs83.64 trillion in June
2026.
Net NSS mobilization reached
Rs292.6bn in FY2025-26, with June contributing Rs23.6bn as inflows
rebounded from May.
Pakistan’s
car sales surged 79.6% YoY to 19,818 units in July 2026, despite a 12.9%
MoM decline.
Pakistan’s workers’
remittances rose 13% YoY and 4.5% MoM to a record $3.63 billion in July
2026.
Index Movers
Sector-wise performance remained largely negative during the
week, with Power Generation & Distribution recording the largest drag on
the KSE-100 Index at 458.58 points, followed by Fertilizer at 397.66 points,
Cement at 246.89 points, Technology & Communication at
236.40 points, Investment Banks/Investment Companies/Securities Companies at
172.52 points and Commercial Banks at 113.39 points.
Other sectors weighing on the benchmark included Insurance
at 59.75 points, Pharmaceuticals at 52.43 points, Textile Composite at 45.53
points, Food & Personal Care Products at 31.68 points,
Tobacco at 25.01 points, Property at 22.60 points, Cable
& Electrical Goods at 18.29 points, Oil & Gas Marketing Companies at
14.54 points, Automobile Assembler at 12.81 points, Glass & Ceramics at
7.92 points,
Automobile Parts & Accessories at 7.29 points, Chemical
at 6.76 points, Paper, Board & Packaging at 5.12 points, Transport at 3.40
points, Textile Spinning at 1.09 points,
Sugar & Allied Industries at 0.33 points, Woollen at
0.15 points, Leasing Companies at 0.06 points and Textile Weaving at 0.03
points.
On the positive side, Oil & Gas Exploration Companies
contributed 296.91 points, followed by Refinery at 159.19 points, Leather &
Tanneries at 76.22 points, Miscellaneous at 62.82 points,
Engineering at 12.08 points, Synthetic & Rayon at 4.44
points, Close-End Mutual Fund at 1.78 points, Real Estate Investment Trust at
0.95 points, Vanaspati & Allied Industries at 0.21 points and Modarabas at
0.20 points.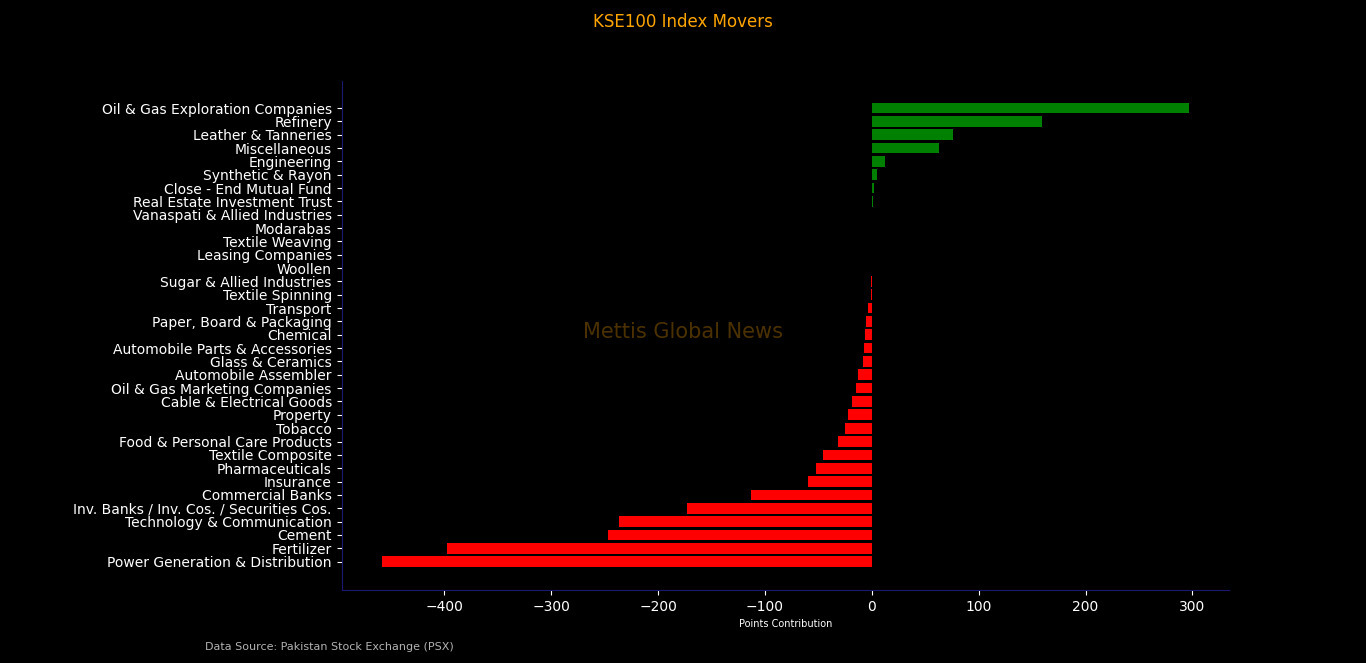
Among individual stocks, HBL emerged as the largest positive
contributor to the index, adding 324.98 points, followed by PPL at 214.33
points, POL at 127.12 points, CNERGY at 84.37 points,
SRVI at 76.22 points, ATRL at 74.82 points, PSEL at 62.08
points, GHNI at 34.75 points, GAL at 29.01 points and MEBL at 16.69 points.
On the downside, HUBC was the biggest drag on the benchmark,
erasing 435.30 points, followed by FFC at 330.01 points, UBL at 201.35 points,
LUCK at 188.27 points,
NGROH at 172.86 points, SYS at 158.94 points, BOP at 91.67
points, EFERT at 82.32 points, BAHL at 71.49 points and AICL at 59.75 points._20260815050410868_4a4912.jpeg)
FIPI/LIPI
Foreign investors remained net sellers during the week,
recording net equity sales of $2.58m.
The selling was primarily driven by Foreign Corporates,
which offloaded equities worth $4.40m. Overseas Pakistanis remained net buyers
with purchases of $1.83m, while Foreign Individuals recorded net sales of
$20,983.
On the local side, investors remained net buyers in the
equity market, recording net purchases of Rs718.59m ($2.58m).
Individuals emerged as the largest local buyers, with net
equity purchases of Rs4.53bn ($16.30m), followed by Companies with Rs1.45bn
($5.23m) and Broker Proprietary Trading with Rs162.42m ($589,293).
The largest sellers were Banks/DFIs, which offloaded
equities worth Rs3.11bn ($11.21m), followed by Insurance Companies with Rs1.75bn
($6.29m), Other Organizations with Rs263.61m ($951,116), Mutual Funds with
Rs196.18m ($712,075) and NBFCs with Rs103.47m ($373,514)._20260815050225655_66a318.jpeg)
Copyright Mettis Link News
Related News
_20260912043126147_4064d7.jpeg?width=280&height=140&format=Webp)
| Name | Price/Vol | %Chg/NChg |
|---|---|---|
| KSE100 | 170,884.59 165.82M | 1.09% 1841.39 |
| ALLSHR | 103,297.23 574.85M | 1.03% 1052.60 |
| KSE30 | 50,883.00 85.37M | 1.16% 585.22 |
| KMI30 | 243,139.25 70.59M | 1.05% 2522.69 |
| KMIALLSHR | 66,979.22 287.59M | 0.99% 655.18 |
| BKTi | 47,642.11 15.25M | 1.66% 776.54 |
| OGTi | 35,136.50 9.94M | 0.68% 237.09 |
| Symbol | Bid/Ask | High/Low |
|---|
| Name | Last | High/Low | Chg/%Chg |
|---|---|---|---|
| BITCOIN FUTURES | 81,100.00 | 81,800.00 81,000.00 | -230.00 -0.28% |
| BRENT CRUDE | 103.37 | 105.00 101.92 | -1.45 -1.38% |
| RICHARDS BAY COAL MONTHLY | 130.00 | 0.00 0.00 | 5.00 4.00% |
| ROTTERDAM COAL MONTHLY | 138.50 | 0.00 0.00 | -0.15 -0.11% |
| USD RBD PALM OLEIN | 1,228.00 | 1,228.00 1,228.00 | 0.00 0.00% |
| CRUDE OIL - WTI | 95.47 | 98.01 94.83 | -1.76 -1.81% |
| SUGAR #11 WORLD | 18.28 | 18.51 18.21 | -0.04 -0.22% |
Chart of the Day
Latest News
Top 5 things to watch in this week
 REER/ NEER Index
Pakistan Stock Movers
| Name | Last | Chg/%Chg |
|---|
| Name | Last | Chg/%Chg |
|---|