
Weekly Market Roundup
MG News | September 05, 2026 at 11:52 AM GMT+05:00

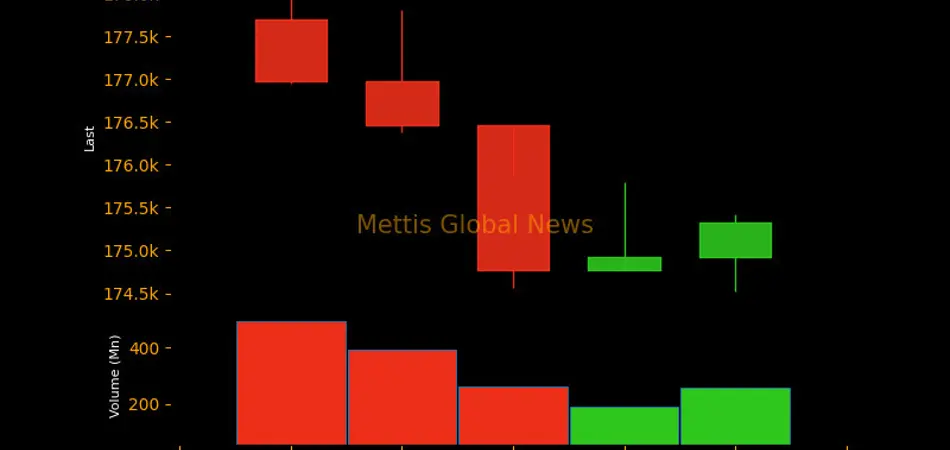
September 05, 2026 (MLN): The benchmark KSE-100 Index closed the week ended September 04, 2026, at 175,328.82 points, losing 2,367.69 points, or 1.33%, on a week-on-week basis from 177,696.51 points recorded on August 28, 2026.
Investor sentiment remained cautious during the week amid
heightened geopolitical uncertainty following the latest escalation between the
United States and Iran.
Renewed military action intensified concerns over potential
disruptions to crude supplies from the Middle East, while uncertainty
surrounding regional stability weighed on risk appetite and kept investors
cautious._20260905061302318_7d47d8.jpeg)
Market Capitalization
The Pakistan Stock Exchange's market capitalization
decreased by Rs70.97bn during the week, falling from Rs5.018tr on
August 28 to Rs4.947tr on September 04, representing a 1.41% WoW decline.
In dollar terms, market capitalization declined from $18.084bn
to $17.834bn, registering a decrease of approximately $250.05m over
the week._20260905061245471_10d1dd.jpeg)
The market's USD-adjusted return stood at -1.30%,
compared with 0.32% in the previous week, reflecting the benchmark's
weekly decline after accounting for currency movements.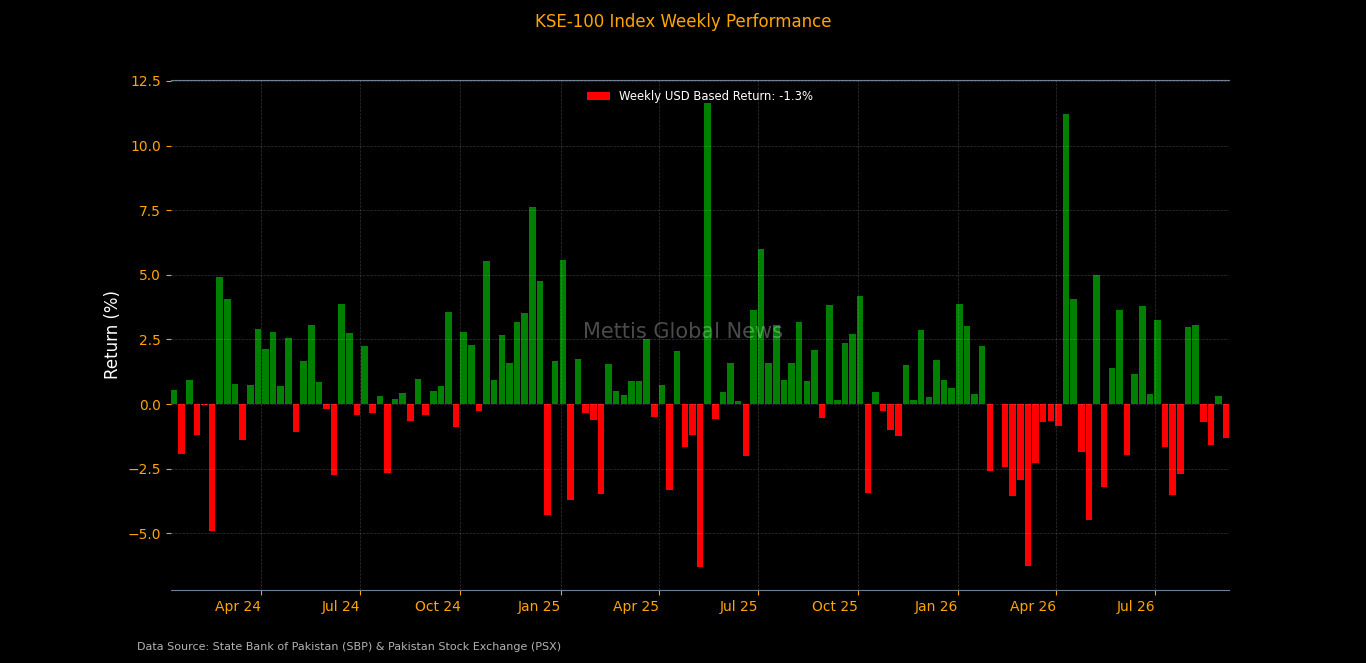
On the macroeconomic front, Pakistan’s foreign
currency assets are projected to face a $24.38bn
net outflow against official reserve assets of $26.63bn,
highlighting significant pressure from near-term external obligations.
Pakistan’s trade deficit narrowed 19.69%
MoM to $3.17bn in August 2026, though the cumulative deficit
for Jul-Aug FY27 widened 18.11% YoY to $7.12bn.
SBP raised
Rs680.07bn through the latest MTB auction, including Rs284.24bn in
competitive and Rs395.83bn in non-competitive bids, against total bids of
Rs2.77tr.
Pakistan’s
CPI inflation surged to 11.1% YoY in August 2026 from 9.2% in July,
while average inflation for 2MFY27 reached 10.17%.
SBP’s net FX purchases fell sharply to $154m
in May 2026, down from $635m in April, while cumulative purchases for
11MFY26 reached $7.263bn, up $81m YoY.
Index Movers
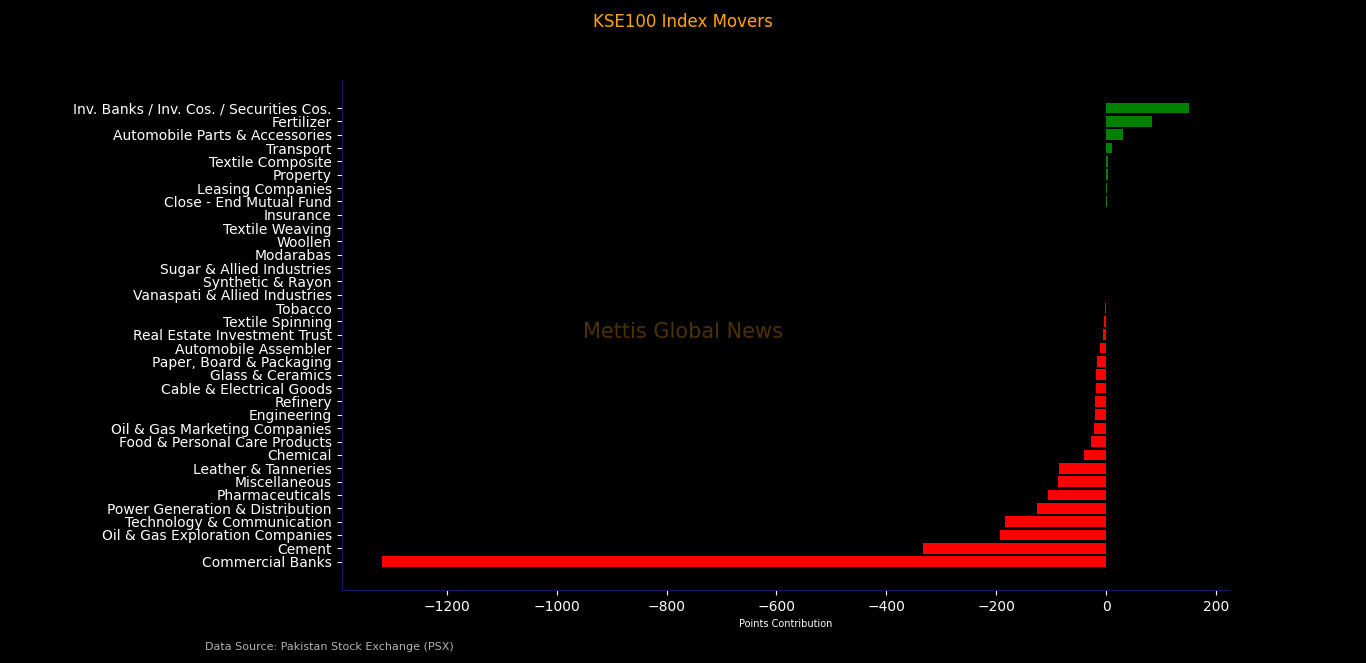
Sector-wise performance remained broadly negative during the
week, with Commercial Banks recording the largest drag on the KSE-100
Index at 1,317.84 points, followed by Cement at 334.08 points,
Oil & Gas Exploration Companies at 194.06 points, Technology
& Communication at 184.97 points, and Power Generation &
Distribution at 126.39 points.
Other sectors weighing on the index included Pharmaceuticals
at 106.30 points, Miscellaneous at 87.71 points, Leather &
Tanneries at 86.41 points, Chemical at 40.49 points, Food &
Personal Care Products at 27.85 points,
Oil & Gas Marketing Companies at 22.13 points, Engineering
at 21.36 points, Refinery at 20.19 points, Cable & Electrical
Goods at 18.18 points, Glass & Ceramics at 17.90 points, Paper,
Board & Packaging at 16.52 points, and Automobile Assembler at
11.97 points.
On the positive side, Inv. Banks / Inv. Cos. / Securities
Cos. provided the largest support at 150.54 points, followed by Fertilizer
at 82.30 points, Automobile Parts & Accessories at 30.84
points,
Transport at 9.68 points, Textile Composite
at 3.36 points, Property at 2.30 points, Leasing
Companies at 1.17 points, Close-End Mutual Funds at 0.56
points, and Insurance at 0.15 points.
Among individual stocks, EFERT emerged as the largest
positive contributor to the index, adding 177.14 points, followed by ENGROH
at 159.06 points, OGDC at 82.28 points,
THALL at 30.84 points, ILP at 25.93
points, MTL at 24.50 points, AKBL at 19.58 points,
TPLRF1 at 12.19 points, PIBTL at 9.68 points, and GAL
at 9.11 points.
Other notable positive contributors included ABL at
7.06 points, HALEON at 5.94 points, ATRL at 3.66 points, JVDC
at 2.30 points, HUMNL at 2.11 points, ATLH at 1.69 points,
PGLC at 1.17 points, RMPL at 0.57 points, HGFA
at 0.56 points, MLCF at 0.51 points, UPFL at 0.48 points, AICL
at 0.15 points and SSGC at 0.12 points.
On the downside, UBL was the biggest drag on the
benchmark, erasing 554.98 points, followed by HBL at 251.75
points, PPL at 232.24 points, MEBL at 141.63 points,
LUCK at 139.04 points, BAHL at 135.56 points, SYS
at 130.30 points, HUBC at 114.44 points, BAFL at 103.10
points, and SRVI at 86.41 points.
Other major negative contributors included PSEL at
67.60 points, FCCL at 56.57 points, FFC at 53.86 points, PTC
at 48.77 points, DGKC at 48.19 points, MCB at 45.55 points,
SEARL at 42.93 points, POL at 42.32 points, NBP
at 39.39 points, FABL at 36.51 points, FATIMA at 35.16 points, INDU
at 24.87 points, CNERGY at 23.85 points, ABOT at 23.21 points, LCI
at 22.38 points, and HMB at 21.38 points._20260905061221323_f6dd4b.jpeg)
FIPI/LIPI
Foreign investors remained net sellers during the
week, recording net equity sales of $7.41m.
The selling was primarily driven by Foreign Corporates,
which offloaded equities worth $12.04m, while Foreign Individuals
recorded net sales of $5,432.
Meanwhile, Overseas Pakistanis remained net buyers
with purchases of $4.63m in equities.
Including debt flows, foreign investors recorded a net
outflow of $7.16m, with Overseas Pakistanis recording net debt purchases of
$253,316.
On the local side, investors remained net buyers in
the equity market, recording net purchases of Rs2.05bn ($7.41m).
Individuals emerged as the largest local buyers, with
net equity purchases of Rs4.61bn ($16.64m), followed by Companies
with Rs1.67bn ($6.03m),
Broker Proprietary Trading with Rs322.13m ($1.16m), Other
Organizations with Rs289.89m ($1.05m), Banks/DFIs with Rs219.10m
($790,958), and NBFCs with Rs13.27m ($47,893).
The largest sellers were Mutual Funds, which
offloaded equities worth Rs5.00bn ($18.06m), followed by Insurance
Companies with Rs69.82m ($252,049).
In the debt market, Banks/DFIs remained significant
net buyers with Rs17.55bn, while Mutual Funds recorded net sales
of Rs18.09bn. Companies recorded net purchases of Rs349.96m, while
Individuals bought Rs112.96m.
Overall, local investors recorded a net purchase of
Rs1.98bn ($7.16m) across equity and debt markets._20260905061222679_8b51bc.jpeg)
Copyright Mettis Link News
Related News
_20260429102856549_d248f0.jpeg?width=280&height=140&format=Webp)
.png?width=280&height=140&format=Webp)

| Name | Price/Vol | %Chg/NChg |
|---|---|---|
| KSE100 | 165,930.99 130.24M | 0.47% 779.34 |
| ALLSHR | 100,610.48 378.72M | 0.45% 449.84 |
| KSE30 | 49,063.88 37.34M | 0.46% 224.35 |
| KMI30 | 238,884.56 81.35M | 0.41% 973.99 |
| KMIALLSHR | 65,270.38 212.83M | 0.42% 270.26 |
| BKTi | 45,897.03 8.93M | 0.66% 303.08 |
| OGTi | 33,673.00 3.31M | 1.09% 362.02 |
| Symbol | Bid/Ask | High/Low |
|---|
| Name | Last | High/Low | Chg/%Chg |
|---|---|---|---|
| BITCOIN FUTURES | 84,660.00 | 85,080.00 82,605.00 | 2090.00 2.53% |
| BRENT CRUDE | 109.84 | 111.32 107.68 | 1.05 0.97% |
| RICHARDS BAY COAL MONTHLY | 128.50 | 0.00 0.00 | -1.75 -1.34% |
| ROTTERDAM COAL MONTHLY | 147.10 | 0.00 0.00 | 1.60 1.10% |
| USD RBD PALM OLEIN | 1,167.50 | 1,167.50 1,167.50 | 0.00 0.00% |
| CRUDE OIL - WTI | 97.82 | 100.40 96.26 | 0.00 0.00% |
| SUGAR #11 WORLD | 20.47 | 20.74 20.27 | -0.05 -0.24% |
Chart of the Day
Latest News
Top 5 things to watch in this week
 Repatriation of Profit and Dividend
Pakistan Stock Movers
| Name | Last | Chg/%Chg |
|---|
| Name | Last | Chg/%Chg |
|---|