
Pakistan LSMI output rises 3% YoY in July 2026

MG News | September 16, 2026 at 02:19 PM GMT+05:00

September 16, 2026 (MLN): Pakistan's Large Scale Manufacturing Industries (LSMI) output rose 3.03% year-on-year (YoY) in July 2026, marking the first month of fiscal year 2026-27, while output climbed 9.51% month-on-month (MoM), according to provisional data released with base year 2015-16, by the Pakistan Bureau of Statistics (PBS).
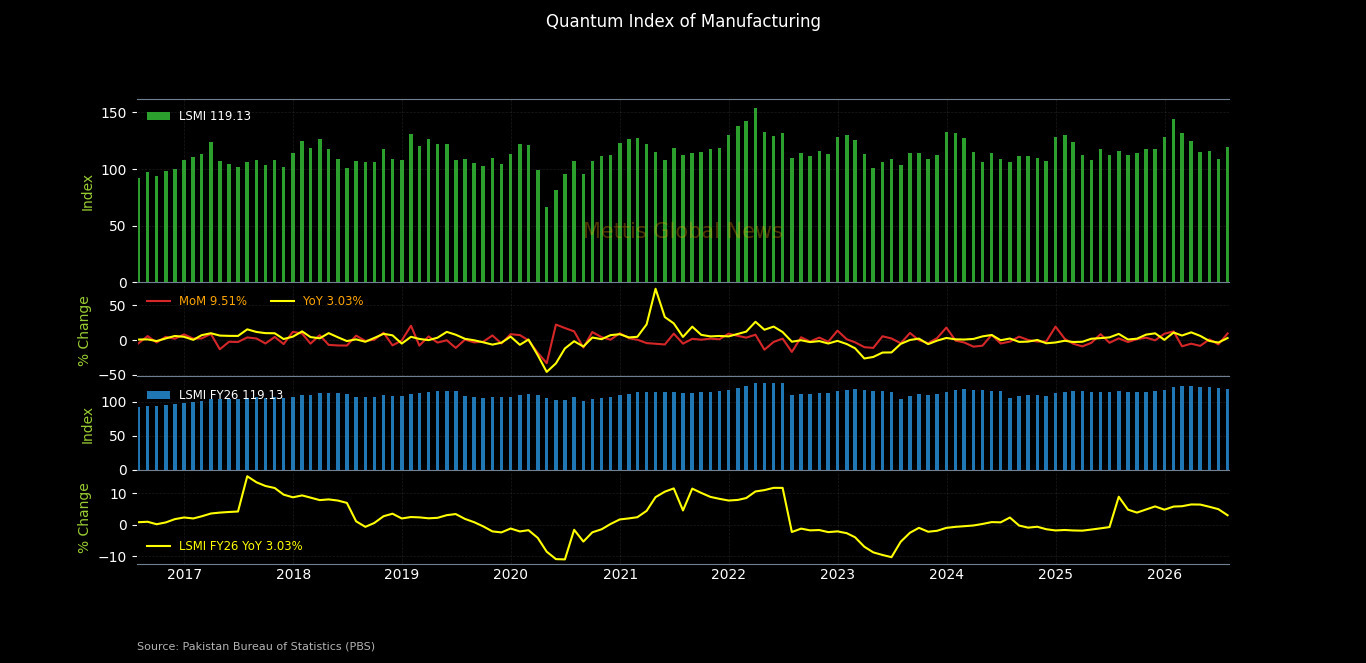
The Quantum Index of Manufacturing (QIM) was recorded at
119.13 in July 2026, compared with 115.62 in July 2025 and 108.78 in June 2026.
Automobiles and garments led the month's performance,
while pharmaceuticals and iron and steel weighed on output.
Growth of Major Manufacturing Items
|
Manufacturing Sector |
Weight% |
% Change July-26 |
|
Cotton Yarn |
8.88 |
2.73 |
|
Cotton Cloth |
7.29 |
-0.09 |
|
Garments |
6.08 |
22.03 |
|
Petroleum Products |
6.66 |
1.34 |
|
Fertilizers |
3.93 |
-4.71 |
|
Cement |
4.65 |
6.17 |
|
Iron & Steel |
3.45 |
-11.40 |
|
Automobile |
3.10 |
57.01 |
The automobile sector extended its strong growth
trajectory, surging 57.01% YoY in July. Garments rose sharply by 22.03%, while
cement gained 6.17% and cotton yarn edged up 2.73% during the month.
Petroleum products posted a modest 1.34% increase, while
fertilizers declined 4.71% YoY. Iron and steel continued its downward trend,
falling 11.40%, and cotton cloth slipped marginally by 0.09%.
Among other sectors, tobacco output jumped 35.82% YoY,
electrical equipment rose 7.88%, and other transport equipment grew 40.22%.
Furniture output increased 10.10%, while wood products
and rubber products posted gains of 2.82% and 1.75%, respectively.
On the decline side, food output fell 6.39%, beverages
dropped 8.77%, and textile output slipped 3.09% YoY. Pharmaceuticals posted the
sharpest fall among major sectors, down 20.79%, while paper and board declined
4.26% and chemicals fell 6.19%, with chemical products down 8.96% and
fertilizers down 4.71% within that group. Machinery and equipment output
dropped 13.33%.
Sectoral Contributions
The main contributors toward the overall 3.03% YoY
growth were garments (3.87 percentage points), automobiles (1.91), tobacco
(0.55), cement (0.36), other transport equipment (0.27), electrical equipment
(0.21), furniture (0.18), and petroleum products (0.11).
Conversely, pharmaceuticals (-1.24), food (-0.84),
textile (-0.53), chemicals (-0.50), iron and steel products (-0.47), beverages
(-0.45), and machinery and equipment (-0.03) weighed on overall growth.
The mixed sectoral performance in July reflects
continued strength in automobiles and garments even as pharmaceuticals, food
and iron and steel remained under pressure at the start of the new fiscal year.
Copyright Mettis Link News
Related News


| Name | Price/Vol | %Chg/NChg |
|---|---|---|
| KSE100 | 168,460.11 192.37M | 1.56% 2592.79 |
| ALLSHR | 101,751.43 430.36M | 1.33% 1336.31 |
| KSE30 | 50,346.10 79.00M | 1.67% 827.62 |
| KMI30 | 242,001.97 76.88M | 1.89% 4490.69 |
| KMIALLSHR | 65,941.73 271.26M | 1.41% 917.47 |
| BKTi | 46,833.75 15.09M | 1.40% 648.42 |
| OGTi | 34,732.22 6.69M | 2.37% 802.83 |
| Symbol | Bid/Ask | High/Low |
|---|
| Name | Last | High/Low | Chg/%Chg |
|---|---|---|---|
| BITCOIN FUTURES | 86,545.00 | 86,675.00 85,350.00 | 540.00 0.63% |
| BRENT CRUDE | 97.82 | 100.99 97.71 | -2.50 -2.49% |
| RICHARDS BAY COAL MONTHLY | 128.50 | 0.00 0.00 | 1.40 1.10% |
| ROTTERDAM COAL MONTHLY | 145.30 | 145.45 145.30 | 1.45 1.01% |
| USD RBD PALM OLEIN | 1,167.50 | 1,167.50 1,167.50 | 0.00 0.00% |
| CRUDE OIL - WTI | 87.22 | 90.05 87.10 | -2.21 -2.47% |
| SUGAR #11 WORLD | 20.80 | 20.90 20.58 | 0.07 0.34% |
Chart of the Day
Latest News
Top 5 things to watch in this week
Pakistan Stock Movers
| Name | Last | Chg/%Chg |
|---|
| Name | Last | Chg/%Chg |
|---|