
Weekly Market Roundup
MG News | September 19, 2026 at 09:05 AM GMT+05:00

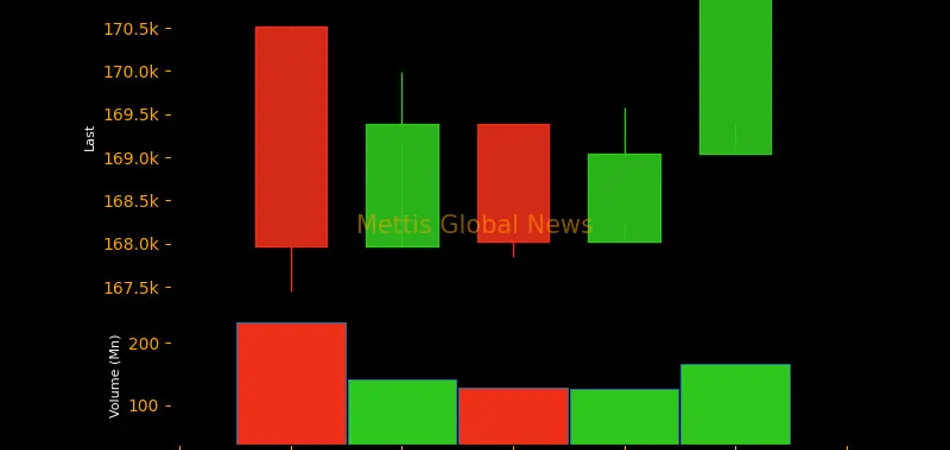
September 19, 2026 (MLN): The benchmark KSE-100 Index
closed the week at 170,884.59 points, gaining 372.73 points or 0.22%
on a week-on-week basis from 170,511.86 points recorded on September 11,
2026.
The weekly gain was supported by improved investor
sentiment following a moderation in global crude oil prices, easing concerns
over potential supply disruptions, and growing expectations of renewed
diplomatic engagement between the US and Iran.
The decline in oil prices and reduced supply-side risks
provided some relief to market participants, while hopes for de-escalation in
regional tensions encouraged risk-taking and triggered buying interest across
the Pakistan Stock Exchange._20260919035808455_41ef3b.jpeg)
Market Capitalization
The Pakistan Stock Exchange's market capitalization
increased to Rs4.815 trillion during the week, compared with Rs4.808
trillion on September 11, 2026, registering an increase of approximately Rs6.46bn,
or 0.13% WoW.
In dollar terms, market capitalization rose from $17.338bn
to $17.366bn, increasing by approximately $27.71 million, or 0.16% WoW._20260919035751651_575362.jpeg)
The market's USD-adjusted return stood at 0.24%,
compared with -2.72% in the previous week, reflecting a recovery in the
benchmark after accounting for currency movements._20260919035742192_535b98.jpeg)
On the macroeconomic front, Pakistan’s
REER rose marginally to 107.92 in August 2026, up 0.02% MoM and 7.71% YoY,
showing a relative strengthening of the rupee in real terms. Meanwhile, NEER
declined 0.79% MoM to 38.02, while the rupee appreciated 0.12% MoM against the
US dollar.
Pakistan’s
LSMI output grew 3.03% YoY and 9.51% MoM in July 2026, marking the first
month of FY27, with automobiles and garments driving growth, while
pharmaceuticals and iron and steel weighed on overall output.
Pakistan’s
current account deficit narrowed 78% MoM to $98 million in August 2026,
supported by robust remittance inflows of $3.66bn. However, the goods and
services trade deficit widened 13.2% YoY to $6.75bn during the first two months
of FY27.
Pakistan’s
passenger car sales rose 36.4% YoY to 13,717 units in August 2026, taking
2MFY27 sales to 30,933 units, up 79.9% YoY. However, monthly sales declined
20.3% from July, while jeeps and pickups fell 53.9% YoY.
Pakistan’s MPC kept the policy
rate unchanged at 11.5%, with seven of 10 members supporting the decision,
while maintaining the FY27 GDP growth projection at 3.5–4.5%. The Committee
expects inflation to gradually ease toward the upper end of the 5–7% target
range by June 2027, though risks have increased.
Index Movers
Sector-wise performance was mixed during the week. Oil
& Gas Exploration Companies provided the largest support to the KSE-100
Index at 298.86 points, followed by Commercial Banks at 213.58
points, Miscellaneous at 211.26 points,
Cement at 131.96 points, Pharmaceuticals
at 50.59 points, Synthetic & Rayon at 20.96 points, Power
Generation & Distribution at 13.41 points, Property at 12.93
points, Tobacco at 10.10 points, Cable & Electrical
Goods at 9.57 points,
Transport at 5.14 points, Engineering
at 4.54 points, Insurance at 4.18 points, Sugar &
Allied Industries at 2.69 points, Vanaspati & Allied
Industries at 0.87 points, Textile Weaving at 0.64 points,
Woollen at 0.51 points, and Leasing Companies at 0.12
points.
On the downside, Automobile Assembler emerged as the
largest drag on the index at 153.62 points, followed by Fertilizer
at 113.45 points, Technology & Communication at 109.05
points, Inv. Banks / Inv. Cos. / Securities Cos. at 62.79 points,
Oil & Gas Marketing Companies at 35.93 points,
Leather & Tanneries at 31.75 points, Glass & Ceramics
at 21.56 points, Food & Personal Care Products at 20.82
points, Textile Composite at 16.13 points, Automobile
Parts & Accessories at 14.99 points,
Paper, Board & Packaging at 12.74 points, Chemical
at 11.52 points, Real Estate Investment Trust at 11.30 points,
Close-End Mutual Fund at 2.35 points, Modarabas at 0.63
points, Refinery at 0.34 points, and Textile Spinning
at 0.18 points.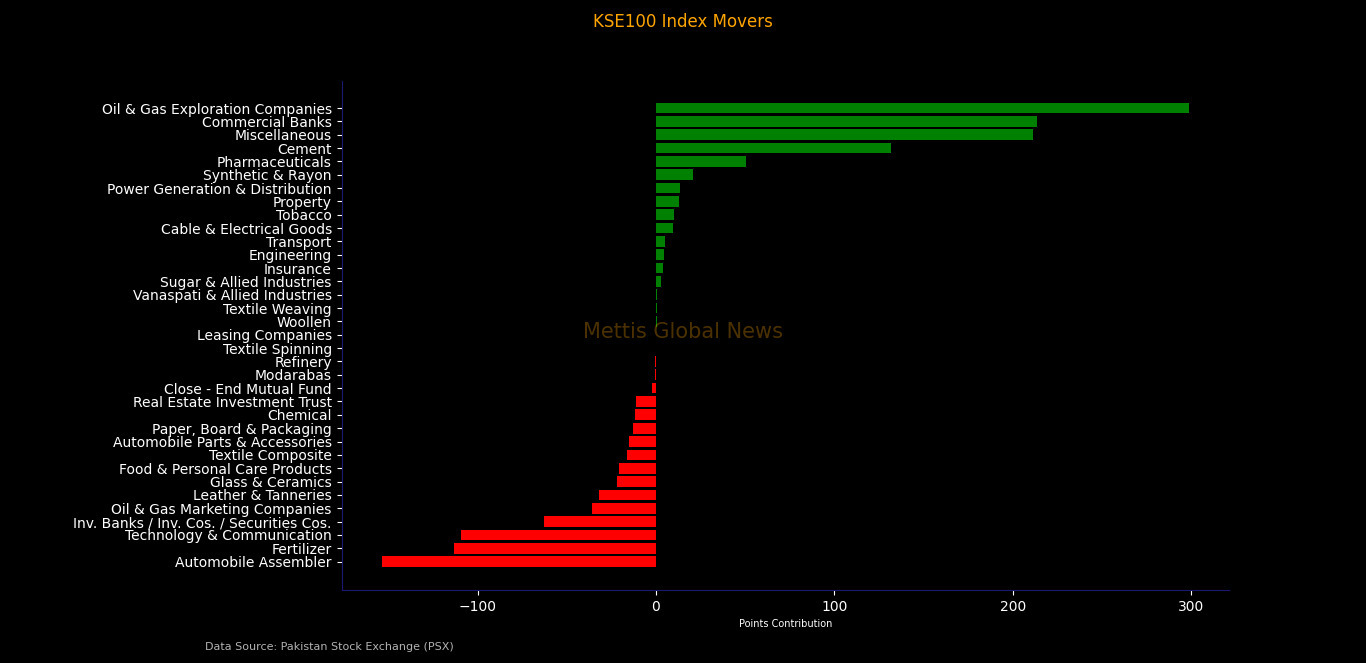
Among individual stocks, PPL emerged as the largest
positive contributor to the index, adding 236.17 points, followed by PSEL
at 224.70 points, UBL at 123.63 points, POL at 118.21
points, BAFL at 98.71 points, MCB at 75.54 points,
LUCK at 67.46 points, FABL at 54.47 points, BAHL
at 50.31 points, and FCCL at 49.06 points.
Other major positive contributors included GLAXO at
34.17 points, AKBL at 25.62 points, IBFL at 20.96 points, CPHL
at 17.43 points, DGKC at 17.28 points, CHCC at 15.31 points, AIRLINK
at 13.64 points, JVDC at 12.93 points,
POWER at 11.88 points, MUREB at 10.27 points, PAKT
at 10.10 points, PAEL at 9.57 points, KTML at 8.79 points, KAPCO
at 8.26 points, HBL at 8.24 points, MARI at 7.80 points, NPL
at 6.64 points, UPFL at 5.29 points, PIBTL at 5.14 points,
ABOT at 4.36 points, AICL at 4.18 points, SCBPL
at 4.12 points, INIL at 3.98 points, AHCL at 3.37 points, INDU
at 3.16 points, SSGC at 2.87 points, HINOON at 2.79 points, JDWS
at 2.69 points, TRG at 2.65 points, HCAR at 1.63 points, HUBC
at 1.42 points,
MEHT at 1.31 points, HALEON at 1.08 points, KOHC
at 1.06 points, SSOM at 0.87 points, YOUW at 0.64 points, ABL
at 0.57 points, ISL at 0.55 points, BNWM at 0.51 points, FFL
at 0.36 points, ATRL at 0.14 points, and PGLC at 0.12 points.
On the downside, NBP was the biggest drag on the
benchmark, erasing 179.45 points, followed by PTC at 67.96
points, FFC at 65.54 points, OGDC at 63.31 points,
GHNI at 58.86 points, SYS at 54.01 points, GAL
at 41.33 points, SAZEW at 41.07 points, ENGROH at 35.17
points, and SRVI at 31.75 points.
Other major negative contributors included FATIMA at
30.61 points, PSX at 27.61 points, BOP at 25.94 points, MEBL
at 21.25 points, PSO at 20.69 points, EFERT at 20.66 points, NATF
at 19.14 points, BWCL at 17.50 points,
TGL at 16.36 points, SNGP at 16.00 points, MTL
at 15.54 points, THALL at 14.99 points, COLG at 13.21 points, PKGS
at 12.74 points, MLCF at 10.66 points, LCI at 10.45 points, PABC
at 8.80 points, DCR at 7.89 points, AGP at 6.96 points, SHFA
at 4.64 points,
NESTLE at 3.56 points, TPLRF1 at 3.42 points, HUMNL
at 3.38 points, KEL at 2.92 points, HGFA at 2.35 points, SEARL
at 2.28 points, APL at 2.11 points, PIOC at 1.93 points, ATLH
at 1.61 points,
NML at 1.49 points, LOTCHEM at 1.07 points, HMB
at 0.99 points, RMPL at 0.84 points, FHAM at 0.63 points, CNERGY
at 0.48 points, and GADT at 0.18 points._20260919035729368_774905.jpeg)
FIPI/LIPI
Foreign investors remained net sellers during the week,
recording net equity sales of $3.36m. The selling was primarily driven
by Foreign Corporates, which offloaded equities worth $5.26m,
while Overseas Pakistanis recorded net equity purchases of $1.90m.
Foreign Individuals recorded net equity purchases of $2,239.
Including debt flows, foreign investors recorded a net
outflow of $3.36m, with Overseas Pakistanis recording net debt sales of $16.
On the local side, investors remained net buyers in the
equity market, recording net purchases of Rs930.57m ($3.36m).
Individuals emerged as the largest local equity buyers, with
net purchases of Rs3.05bn ($10.99m), followed by Banks/DFIs with Rs718.64m
($2.59m), Insurance Companies with Rs489.88m ($1.77m), Other
Organizations with Rs456.33m ($1.65m) and Companies with Rs204.98m
($739,986).
Meanwhile, Mutual Funds remained the largest local equity
sellers, with net sales of Rs3.52bn ($12.72m), followed by Broker
Proprietary Trading with Rs433.97m ($1.57m) and NBFCs with Rs27.87m
($100,632).
In the debt market, Mutual Funds remained significant net
buyers with Rs21.92bn, followed by Other Organizations with Rs3.56bn
and Insurance Companies with Rs523.45m. Banks/DFIs recorded net debt
sales of Rs25.96bn, while Broker Proprietary Trading posted net sales of
Rs542,893 and Companies recorded net debt sales of Rs50.72m.
Overall, local investors recorded a net purchase of
Rs930.58m ($3.36m) across equity and debt markets.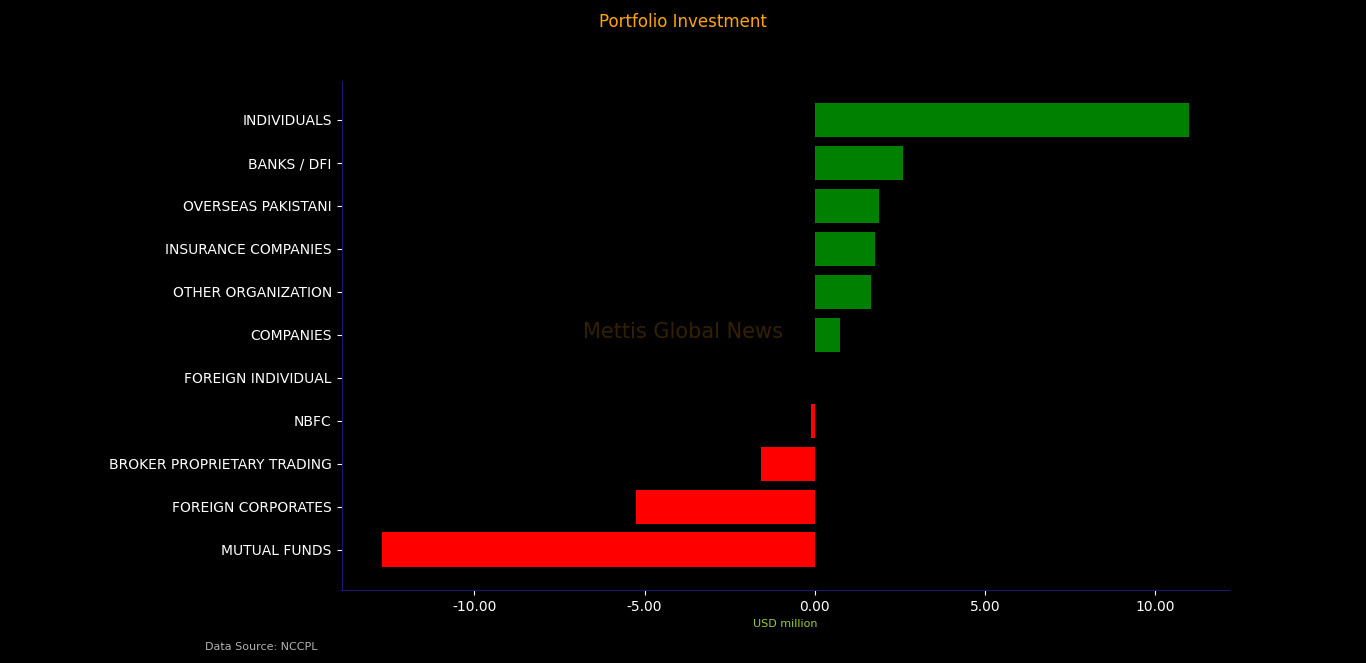
Copyright Mettis Link News
Related News

_20260429102856549_d248f0.jpeg?width=280&height=140&format=Webp)
.png?width=280&height=140&format=Webp)
| Name | Price/Vol | %Chg/NChg |
|---|---|---|
| KSE100 | 165,930.99 130.24M | 0.47% 779.34 |
| ALLSHR | 100,610.48 378.72M | 0.45% 449.84 |
| KSE30 | 49,063.88 37.34M | 0.46% 224.35 |
| KMI30 | 238,884.56 81.35M | 0.41% 973.99 |
| KMIALLSHR | 65,270.38 212.83M | 0.42% 270.26 |
| BKTi | 45,897.03 8.93M | 0.66% 303.08 |
| OGTi | 33,673.00 3.31M | 1.09% 362.02 |
| Symbol | Bid/Ask | High/Low |
|---|
| Name | Last | High/Low | Chg/%Chg |
|---|---|---|---|
| BITCOIN FUTURES | 84,660.00 | 85,080.00 82,605.00 | 2090.00 2.53% |
| BRENT CRUDE | 109.84 | 111.32 107.68 | 1.05 0.97% |
| RICHARDS BAY COAL MONTHLY | 128.50 | 0.00 0.00 | -1.75 -1.34% |
| ROTTERDAM COAL MONTHLY | 147.10 | 0.00 0.00 | 1.60 1.10% |
| USD RBD PALM OLEIN | 1,167.50 | 1,167.50 1,167.50 | 0.00 0.00% |
| CRUDE OIL - WTI | 97.82 | 100.40 96.26 | 0.00 0.00% |
| SUGAR #11 WORLD | 20.47 | 20.74 20.27 | -0.05 -0.24% |
Chart of the Day
Latest News
Top 5 things to watch in this week
 Repatriation of Profit and Dividend
Pakistan Stock Movers
| Name | Last | Chg/%Chg |
|---|
| Name | Last | Chg/%Chg |
|---|