PSX in January
_20260202100857792_99ea0c.jpeg?width=950&height=450&format=Webp)
Nilam Bano | February 02, 2026 at 04:03 PM GMT+05:00

February 2, 2026 (MLN): The KSE-100 Index delivered a strong performance during January 2026, rising by more than 10,100 points on a month-on-month basis on improving liquidity conditions and steady corporate result flows.
Buying interest remained resilient throughout the month that
allowed the index to sustain gains despite intermittent geopolitical noise,
earnings-related uncertainty, and the absence of a widely expected policy rate
cut.
The benchmark ultimately closed the month above the 184,000 level that reflected sustained strength and broad-based participation.
_20260202101713812_a09748.jpeg)
The market capitalization in January 2026 reached PKR 5.438 trillion, up from PKR 5.109 trillion at the end of December 2025, representing a month-on-month increase of approximately 6.38%.
Compared to January 2025, when market capitalization stood
at PKR 3.525 trillion, the year-on-year growth was a remarkable 54.2%.
In USD terms, market capitalization rose to $19.44 billion from $18.24 billion last month, marking a monthly increase of around 6.6%, and compared to $12.64 billion in January 2025, a year-on-year growth of roughly 53.8%.
_20260202100816418_4a6e0d.jpeg)
In terms of returns, the USD-based KSE-100 index appreciated 5.95% during January 2026, compared with 4.57% in December 2025 and a slight decline of 0.90% in January 2025, reflecting a combination of strong local market performance and relative currency stability.
_20260202100748416_2a8e31.jpeg)
The PKR/USD exchange rate eased slightly during the month,
closing at Rs 279.77 per USD compared with Rs 280.12 in December 2025 and Rs
278.95 a year ago, reflecting marginal currency stability.
Market activity was strongest in the early part of the month, followed by periods of consolidation that indicated profit-taking rather than a reversal in trend.
Overall price action remained constructive, with
pullbacks proving limited and short-lived.
Macroeconomic Landscape
Inflationary pressures continued to ease, with CPI inflation
slowing to 5.6% YoY in December 2025, compared with 6.1% in November. For CY25,
average inflation stood at 3.5%, the lowest level in a decade, supported by
favorable base effects, softer food prices, and lower petroleum costs.
On the external
front, Pakistan recorded a $244 million current account deficit in December
2025, reversing recent monthly surpluses. As a result, the 1HFY26 current
account balance shifted to a deficit of $1.17 billion, compared to a $957
million surplus in the same period last year.
Industrial activity showed encouraging signs, as Large-Scale Manufacturing Index (LSMI) output increased by 10.4% YoY in November 2025,
along with a 0.2% MoM uptick, indicating gradual recovery momentum in key
industrial segments.
Worker remittances remained a key support, rising 17% YoY to $3.6 billion in December 2025. Cumulative inflows during 1HFY26 reached $19.7 billion, reflecting an 11% YoY increase and helping cushion pressure on the external account.
In the construction-linked sector, cement dispatches rose
1.47% YoY to 4.34 million tons in December 2025, reflecting stable domestic
demand. Within fertilizers, urea sales increased 2.3% YoY to 6.7 million tons
in CY25.
Fertilizer consumption in Pakistan witnessed strong performance in December 2025, as overall nutrient offtake increased by 23% year-on-year to 770,000 tonnes, according to the latest Monthly Fertilizer Review released by the National Fertilizer Development Centre (NFDC).
Urea offtake was at 1,356,000 tonnes in December, registering an increase of 36.8% compared to the same month last year. On the other hand, DAP consumption decreased by 44.6%, to 80,000 tonnes.
The energy sector showed mixed trends. OMC sales grew 6% YoY
to 1.35 million tons in December 2025, driven by an 11% YoY increase in MS
consumption, supported by higher automobile sales.
Power generation increased 8.8% YoY to 8,487 GWh in December
2025, marking the second-highest monthly output on record.
In the auto sector,
Conversely, on a month-on-month basis, auto sales decreased by 14.0% compared to 15,442 units sold in November 2025.
Meanwhile, central government debt increased to Rs77.5 trillion in November 2025, registering a 10.2% YoY rise and a 0.7% MoM increase.
Index Movers:
Looking at broader sectoral movements, the strongest
positive performance came from Commercial Banks, Oil & Gas Exploration
Companies, and Automobile Assemblers.
Commercial Banks led sectoral gains with a massive
contribution of 5,002 points, followed by Oil & Gas Exploration Companies
at 2,074 points, and Automobile Assemblers adding 617 points.
Power Generation & Distribution contributed 340 points,
while the Property sector added 295 points.
On the other hand, the Technology & Communication sector was the weakest performer, declining by 423 points, followed by Miscellaneous (-221 points), Cement (-191 points), and Food & Personal Care Products (-36 points), reflecting selective profit-taking and sector-specific pressures.
_20260202100839088_8bd88e.jpeg)
Among individual movers, UBL emerged as the top contributor
to market gains, adding 1,860 points, followed by PPL with 951 points and OGDC
at 942 points.
Other notable gainers included ENGROH (805 points), MEBL
(679 points), and NBP (456 points).
Meanwhile, scrips that underperformed included SYS with a loss of 489 points, PSEL (-277 points), and PIOC (-174 points), highlighting selective pressure on certain large-cap names amid profit-booking activity.
_20260202100706478_b21585.jpeg)
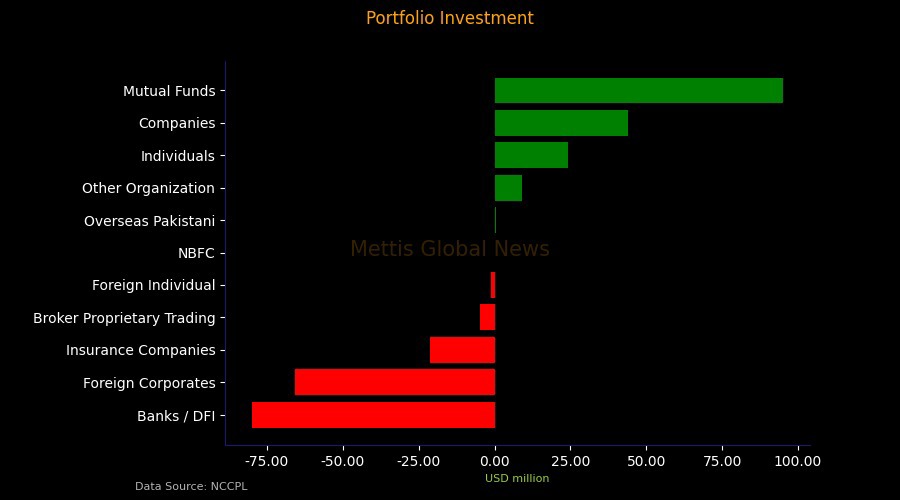
From the perspective of foreign and local investor activity, foreign institutional participation remained subdued.
Foreign corporates sold $65.8
million, and foreign individuals offloaded $1.03 million, while overseas
Pakistanis recorded modest net buying of $0.423 million, leaving the overall Foreign
Institutional Portfolio Investment (FIPI) at a net outflow of $66.46 million.
In contrast, local
institutional participation was robust and supportive, with banks and DFIs net
sellers of $80 million, broker proprietary trading selling $4.75 million, and
insurance companies selling $21.22 million.
On the buying side, companies contributed $44.05 million,
individuals $24.17 million, mutual funds $95.21 million, NBFCs $0.11 million,
and other organizations $8.96 million, leading to a net LIPI inflow of $66.46
million.
The offsetting activity of local investors effectively
cushioned foreign selling, supporting overall market stability.
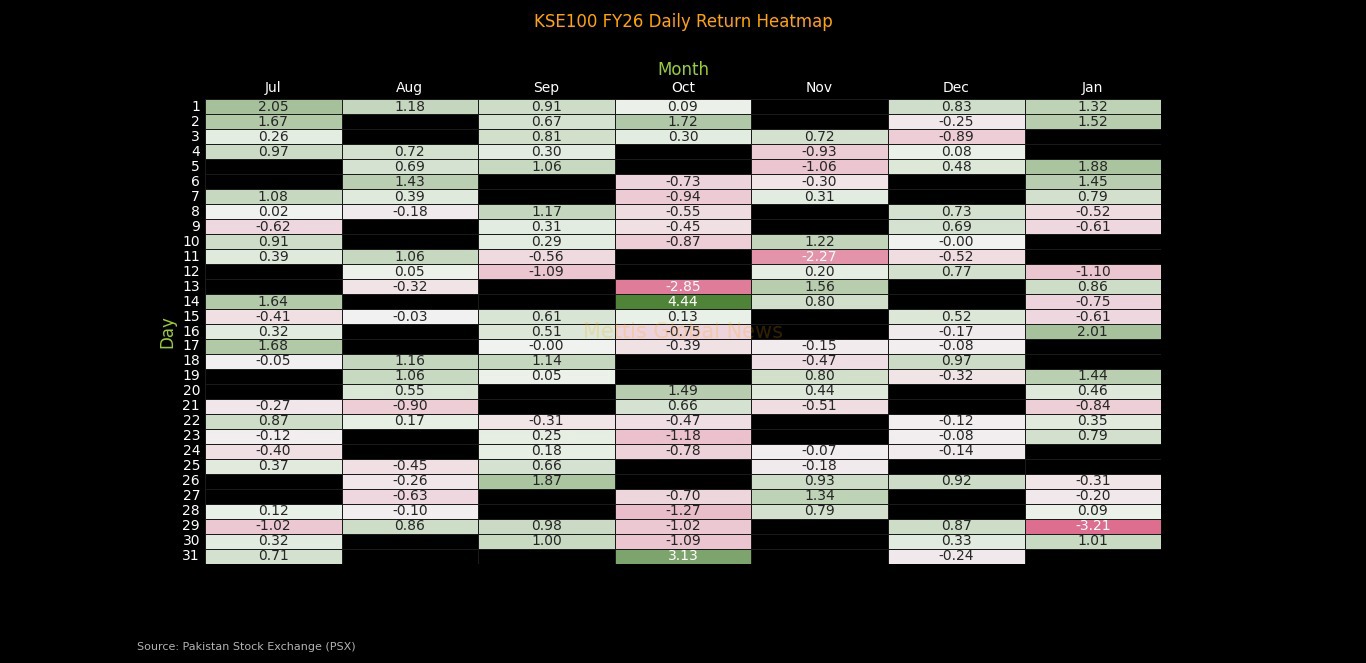
The below heatmap displays the daily percentage returns of
the KSE100 index for fiscal year 2026, spanning from July 2025 to January 2026.
The most significant single-day gain occurred on October
14th with a +4.44% return whereas the worst day was October 13th with a -2.85%
loss.
October stands out as the most volatile month, featuring
both the largest gain and loss. The month shows a clear pattern of sharp
reversals, particularly in mid-October with consecutive days of extreme
movements.
January 2026 shows relatively strong performance with
several green days, including a notable +2.01% gain on the 16th and +1.88%
on the 5th, suggesting positive momentum at the start of the calendar year.
November experienced mixed results with some volatility,
while September and December showed more moderate, range-bound trading
patterns.
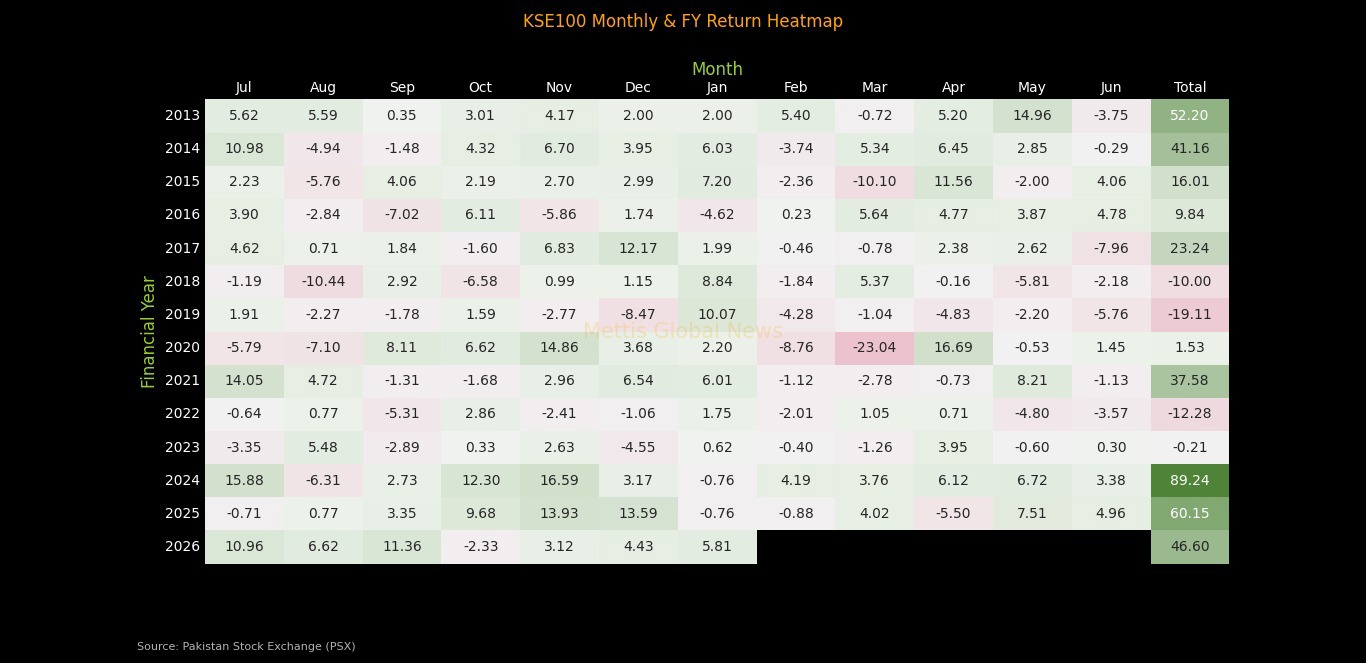
The strongest fiscal year was 2024 with an impressive
+89.24% return, representing exceptional market performance. This was
followed by 2025 with +60.15% and 2013 with +52.20%, indicating
periods of strong bull markets.
The worst performance occurred in 2019 with -19.11%,
followed by 2022 at -12.28% and 2018 at -10.00%.
May 2013 stands out with the highest single-month
return of +14.96%. Other notable monthly gains include July 2021 with +14.05%,
November 2024 with +16.59%, December 2025 with +13.59 and November 2020 with
+14.86%
The most severe monthly losses include March 2020 with -23.04%
(likely COVID-19 pandemic impact), March 2015 with -10.10% and August 2018 with
-10.44% return.
Seasonal Trends:
Looking at patterns across years, certain months show
recurring tendencies. November and December have historically delivered strong
returns in multiple years (2017, 2020, 2024, 2025), suggesting a potential
year-end rally pattern.
Conversely, March has experienced significant volatility,
with extreme losses in 2020 and 2015.
The monthly and fiscal year returns of
the KSE100 index in USD terms from 2013 to 2026 provides a crucial
perspective on how Pakistani equities have performed for international
investors after accounting for currency fluctuations.
The standout year is 2024 with an exceptional +94.44%
return, shown in the brightest green, representing extraordinary performance
for dollar-based investors.
This was followed by 2025 at +57.09% and 2021 at +46.75%,
indicating strong periods where both equity gains and currency stability or
appreciation worked in investors' favor.
The most challenging years tell a different story, with 2019
posting the worst fiscal year at -38.60%, followed by 2022 at -32.54%, 2023 at
-28.52%, and 2018 at -22.32%.
Comparing this USD-denominated heatmap with the
PKR-denominated version reveals the substantial impact of exchange rate
movements.
In 2019, the PKR market was down -19.11%, but USD investors
lost -38.60% due to rupee depreciation, essentially doubling the loss
experienced by local investors.
The strongest single-month performance was July 2021 at
+14.78%, followed by notable gains in May 2013 at +14.85%, November 2020 at
+15.18%, April 2020 at +21.45% representing a recovery from the COVID crash,
and October 2024 at +14.80%.
As of January 2026, the fiscal year shows a +48.70% USD
return, with strong performances in July 2026 at +11.31%, September 2026 at
+11.54%, and August 2026 at +7.04%.
_20260202100627709_cb8855.jpeg)
Copyright Mettis Link News
Related News


| Name | Price/Vol | %Chg/NChg |
|---|---|---|
| KSE100 | 180,440.08 313.04M | -0.99% -1801.69 |
| ALLSHR | 109,591.89 713.12M | -0.90% -991.78 |
| KSE30 | 53,872.38 71.56M | -1.03% -559.33 |
| KMI30 | 254,139.42 90.17M | -1.08% -2774.79 |
| KMIALLSHR | 70,319.19 465.39M | -1.02% -722.11 |
| BKTi | 51,238.64 14.76M | -0.92% -474.12 |
| OGTi | 36,269.50 6.16M | -1.06% -390.08 |
| Symbol | Bid/Ask | High/Low |
|---|
| Name | Last | High/Low | Chg/%Chg |
|---|---|---|---|
| BITCOIN FUTURES | 63,205.00 | 64,680.00 62,605.00 | -880.00 -1.37% |
| BRENT CRUDE | 77.44 | 79.80 77.38 | 1.43 1.88% |
| RICHARDS BAY COAL MONTHLY | 105.75 | 0.00 0.00 | -1.15 -1.08% |
| ROTTERDAM COAL MONTHLY | 118.00 | 0.00 0.00 | 0.65 0.55% |
| USD RBD PALM OLEIN | 1,135.00 | 1,135.00 1,135.00 | 0.00 0.00% |
| CRUDE OIL - WTI | 72.73 | 75.08 72.67 | 1.32 1.85% |
| SUGAR #11 WORLD | 14.68 | 14.98 14.65 | -0.20 -1.34% |
Chart of the Day
Latest News
Top 5 things to watch in this week
Pakistan Stock Movers
| Name | Last | Chg/%Chg |
|---|
| Name | Last | Chg/%Chg |
|---|