Weekly Market Roundup

MG News | February 22, 2026 at 04:29 PM GMT+05:00

February 22, 2026 (MLN): Pakistan’s equity market endured a bruising week as the benchmark KSE-100 Index plunged to 173,170, registering a sharp decline of 3.6% week-on-week amid sustained selling pressure and heightened geopolitical uncertainty.
The index has now shed 15,997 points from its January 2026 peak of 189,167, an 8.5% drop that signals a meaningful market correction rather than routine volatility.
Persistent risk aversion kept buyers on the sidelines, allowing bearish momentum to dominate trading throughout the week at the Pakistan Stock Exchange.
Geopolitical tensions, cautious investor sentiment, and continuous profit-taking emerged as the primary drivers behind the slump.
_20260222111805727_d3f48c.jpeg)
Market Capitalization
Market capitalization mirrored the index’s decline. Total listed value fell to PKR 5.11 trillion this week from PKR 5.30tr last week, a contraction of about 3.6% week-on-week.
Compared with the peak market capitalization of PKR 5.44tr recorded on January 23, 2026, the market has lost roughly PKR 329bn, translating into a 6.1% erosion in value.
In dollar terms, capitalization dropped to $18.27bn from $18.95bn a week earlier, again a decline of around 3.6%. Relative to the January peak valuation of $19.97bn, the market has shrunk by approximately 8.5% in USD terms, reflecting both falling equity prices and currency dynamics.
_20260222111755663_3a884c.jpeg)
Dollar-adjusted returns for the week stood at -3.56%, deteriorating from -2.42% last week and a positive 2.22% during the peak week in January, highlighting the sharp reversal in foreign-currency performance.
The exchange rate remained largely steady at PKR 279.56 per dollar versus 279.62 last week, indicating that equity losses, not currency weakness, drove most of the USD decline.
_20260222111746951_db38de.jpeg)
Periodic Drawdowns
The long-term performance of the KSE-100 reflects a powerful multi-year bull cycle punctuated by periodic but sharp drawdowns.
From mid-2023 onward, the index entered a steep upward trajectory, ultimately peaking near 189,167 in January 2026, reflecting improved macro stability, declining external risks, and strong domestic liquidity.
However, the recent pullback to around 173,170 represents a drawdown of roughly 8.5%, which, while abrupt, remains moderate relative to historical corrections shown in the chart, many of which exceeded double-digit declines.
Historically, the Pakistan Stock Exchange has experienced deeper and more prolonged corrections, particularly during periods of political uncertainty, currency crises, or tightening financial conditions.
The current decline, although uncomfortable for short-term investors, sits close to the chart’s indicated average drawdown band (around mid-single digits).
_20260222111732444_6b6f5c.jpeg)
On the macro front, large-scale manufacturing output posted modest growth of 0.4% year-on-year in December 2025 and surged 9.3% month-on-month.
Total inflows into Roshan Digital Accounts (RDA) during January 2026 stood at $216 milliom, bringing cumulative inflows into RDA to $11.923 billion.
The sales of cars, including LCVs, vans, and jeeps, in Pakistan increased by 35.5% in January 2026, clocking in at 23,055 units compared to 17,010 units recorded in the same month of last year.
The country posted a monthly current account surplus of $121mn, though the cumulative balance for 7MFY26 remained in deficit at $1.07bn compared to last year’s surplus.
Foreign direct investment improved sequentially to a net inflow of $173mn in January 2026.
Power sector kicked off 2026 with a record-breaking performance, as it generated 9,140 GWh in January the highest output ever recorded for the month up 12.1% year-on-year (YoY) from 8,153 GWh in January 2025..
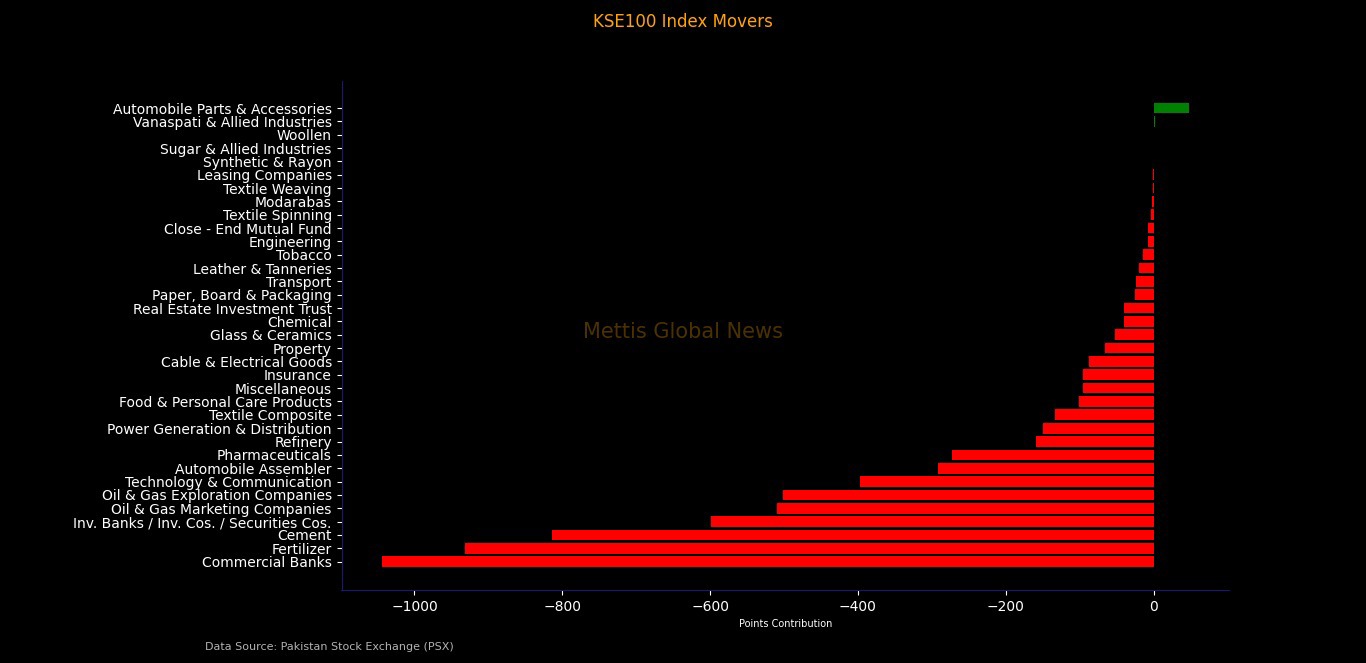
Index Movers
Commercial banks emerged as the largest drag, wiping out more than 1,044 index points amid heavy volumes, followed by fertilizers, cement, investment companies, oil marketing firms, and exploration companies.
Technology, automobiles, pharmaceuticals, refineries, and power producers also contributed sizeable negative points, confirming that selling pressure was systemic rather than isolated.
The only notable positive contribution came from automobile parts manufacturers, which added roughly 48 points, while most other sectors either declined or remained flat.
At the company level, the few gainers were overshadowed by widespread losses.
Thal Limited led the positive side, followed by Indus Motor Company’s engineering affiliate INIL, Pakistan Telecommunication Company, Nestlé Pakistan, and Murree Brewery, though their cumulative impact was modest.
Fertilizer giant Fauji Fertilizer Company alone erased nearly 690 points, while major conglomerates, banks, cement producers, and energy companies also recorded steep declines.
Large exploration firms, refineries, technology leaders, and automobile assemblers featured prominently among the worst performers, indicating institutional-scale selling rather than retail-driven volatility.
_20260222111725165_bdc7c6.jpeg)
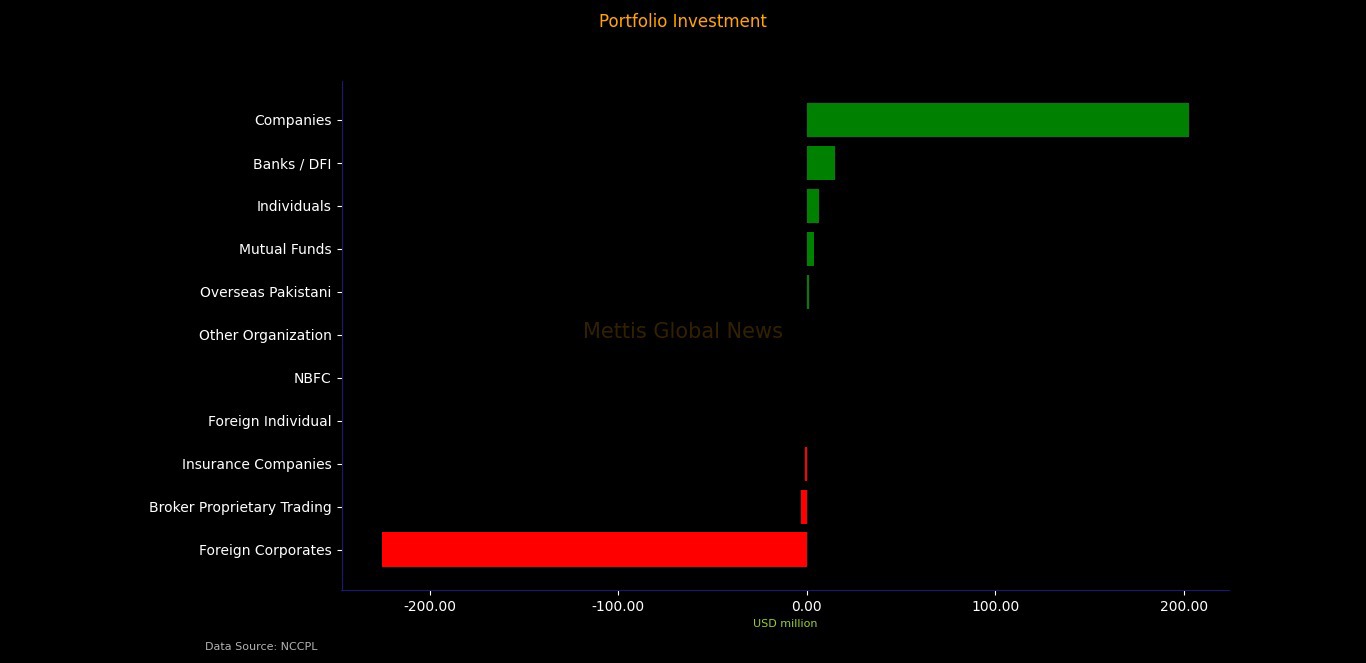
FIPI/LIPI
Foreign investment flows further explain the pressure. Foreign investors were aggressive net sellers, offloading approximately $224.35mn worth of equities, driven almost entirely by foreign corporates.
Overseas Pakistani individuals provided only limited support with modest net buying. In contrast, local participants absorbed nearly the entire outflow, resulting in a matching net inflow of $224.35mn.
Domestic companies emerged as the biggest buyers with purchases exceeding $202mn, followed by banks, individuals, mutual funds, and other institutions.
Copyright Mettis Link News
Related News


| Name | Price/Vol | %Chg/NChg |
|---|---|---|
| KSE100 | 180,440.08 313.04M | -0.99% -1801.69 |
| ALLSHR | 109,591.89 713.12M | -0.90% -991.78 |
| KSE30 | 53,872.38 71.56M | -1.03% -559.33 |
| KMI30 | 254,139.42 90.17M | -1.08% -2774.79 |
| KMIALLSHR | 70,319.19 465.39M | -1.02% -722.11 |
| BKTi | 51,238.64 14.76M | -0.92% -474.12 |
| OGTi | 36,269.50 6.16M | -1.06% -390.08 |
| Symbol | Bid/Ask | High/Low |
|---|
| Name | Last | High/Low | Chg/%Chg |
|---|---|---|---|
| BITCOIN FUTURES | 63,205.00 | 64,680.00 62,605.00 | -880.00 -1.37% |
| BRENT CRUDE | 77.44 | 79.80 77.38 | 1.43 1.88% |
| RICHARDS BAY COAL MONTHLY | 105.75 | 0.00 0.00 | -1.15 -1.08% |
| ROTTERDAM COAL MONTHLY | 118.00 | 0.00 0.00 | 0.65 0.55% |
| USD RBD PALM OLEIN | 1,135.00 | 1,135.00 1,135.00 | 0.00 0.00% |
| CRUDE OIL - WTI | 72.73 | 75.08 72.67 | 1.32 1.85% |
| SUGAR #11 WORLD | 14.68 | 14.98 14.65 | -0.20 -1.34% |
Chart of the Day
Latest News
Top 5 things to watch in this week
Pakistan Stock Movers
| Name | Last | Chg/%Chg |
|---|
| Name | Last | Chg/%Chg |
|---|