HBL rewards 22.5% DPS after profit jumps to Rs42.82bn in 9MCY23

MG News | October 25, 2023 at 03:59 PM GMT+05:00

October 25, 2023 (MLN): Habib Bank Limited (PSX: HBL’s) profit for the 9MCY23 surged by 97.32% YoY to Rs42.82billion [EPS: 29.19], compared to Rs21.7bn [EPS: 14.79] recorded in the Same Period Last Year (SPLY), bank’s filing on PSX revealed today.
Along with the 9MCY23, the Board of Directors (BoD) of HBL has recommended an interim cash dividend for 3QCY23 at Rs2.25/- per share i.e. 22.5%.
This is in addition to interim Dividend(s) already paid at Rs3.5/- per share i.e. 35%.
Going by the income statement, the bank witnessed an increase of 53.28% YoY in its net interest income (NII) to stand at Rs164.28bn, compared to Rs107.18bn in SPLY. The surge in NII is due to a jump in interest-earning (Rs479.82bn), up by 65.45% YoY.
During the period under review, the bank’s total non-markup income also increased by 29.56% YoY to Rs37.14bn, owing to a massive jump in fee, commission, and brokerage income of 34.63% YoY to Rs26.91bn.
However, HBL’s net foreign exchange income went down by 92.04% YoY to Rs781.99m during the review period.
Going forward, the bank incurred a loss on the sale of securities of Rs325.45m in 9MCY23, compared to a gain of Rs687.31m reported in the SPLY.
The profit and loss statement shows that the provision expense of the bank increased by 2.61x to Rs6.16bn during the review period, compared to Rs2.36bn recorded in 9MCY22.
On the expense side, the total non-markup expenses increased by 36.94% to Rs112.24bn in 9MCY23 compared to Rs81.96bn in 9MCY22.
The increase was attributed to the jump of 37.29% YoY in the operating expenses from Rs80.48bn in 9MCY22 to Rs110.5bn in 9MCY23.
Additionally, the bank’s expenses related to the Workers' Welfare Fund also went up during the review period.
On the tax front, the bank paid Rs40.2bn, 97.32% YoY higher than the amount paid in 9MCY22.
| Consolidated Profit and Loss Account for the nine months ended September 30, 2023 (Rupees '000) | |||
|---|---|---|---|
| Sep-23 | Sep-22 | % Change | |
| Mark-up/return/profit/interest earned | 479,819,379 | 290,012,963 | 65.45% |
| Mark-up/return/profit/interest expensed | 315,537,127 | 182,837,778 | 72.58% |
| Net mark-up/return/profit/interest income | 164,282,252 | 107,175,185 | 53.28% |
| Non mark-up/interest income | |||
| Fee, commission and brokerage income | 26,908,502 | 19,986,361 | 34.63% |
| Dividend income | 3,027,681 | 1,216,515 | 148.88% |
| Net Foreign Exchange Income/(loss) | 781,986 | 9,825,944 | -92.04% |
| Income/(loss) from derivatives | (3,140,330) | (3,412,516) | -7.98% |
| Gain/ (loss) on sale of securities - net | (325,450) | 687,309 | - |
| Other income | 9,883,533 | 358,670 | 2655.61% |
| Total non mark-up /interest income | 37,135,922 | 28,662,283 | 29.56% |
| Total income | 201,418,174 | 135,837,468 | 48.28% |
| Non mark-up/interest expenses | |||
| Operating expenses | 110,496,644 | 80,482,078 | 37.29% |
| Workers' Welfare Fund | 1,661,993 | 1,030,352 | 61.30% |
| Other charges | 82,090 | 450,995 | -81.80% |
| Total non mark-up/interest expenses | 112,240,727 | 81,963,425 | 36.94% |
| Profit before provisions and taxation | 89,177,447 | 53,874,043 | 65.53% |
| Provisions and write offs-net | 6,159,440 | 2,355,915 | 161.45% |
| Profit before taxation | 83,018,007 | 51,518,128 | 61.14% |
| Taxation | 40,200,911 | 29,819,141 | 34.82% |
| Profit after taxation | 42,817,096 | 21,698,987 | 97.32% |
| Earnings per share - basic and diluted (Rupees) | 29.19 | 14.79 | - |
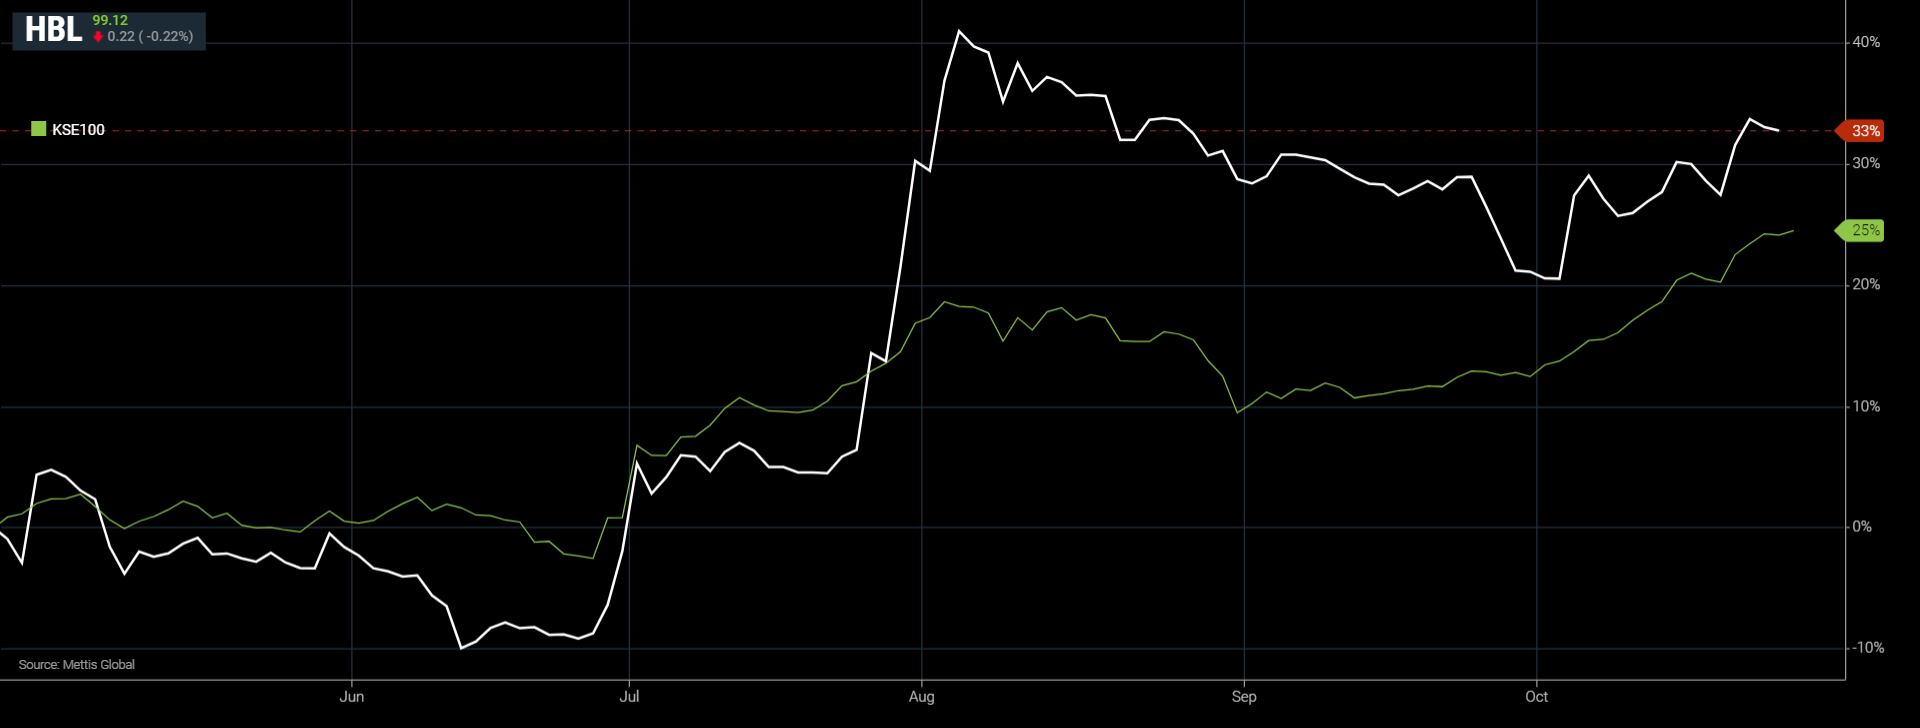
HBL and KSE-100 YTD Performance
Copyright Mettis Link News
Related News


| Name | Price/Vol | %Chg/NChg |
|---|---|---|
| KSE100 | 171,021.20 228.53M | -0.42% -718.25 |
| ALLSHR | 103,836.39 572.65M | -0.41% -422.85 |
| KSE30 | 50,951.99 89.47M | -0.52% -264.77 |
| KMI30 | 240,633.87 93.99M | -0.31% -756.80 |
| KMIALLSHR | 66,572.75 300.61M | -0.28% -185.59 |
| BKTi | 48,673.23 31.18M | -0.70% -343.86 |
| OGTi | 33,702.25 6.35M | -0.61% -205.57 |
| Symbol | Bid/Ask | High/Low |
|---|
| Name | Last | High/Low | Chg/%Chg |
|---|---|---|---|
| BITCOIN FUTURES | 64,520.00 | 64,550.00 63,875.00 | 305.00 0.48% |
| BRENT CRUDE | 98.70 | 101.19 95.13 | -1.99 -1.98% |
| RICHARDS BAY COAL MONTHLY | 105.75 | 0.00 0.00 | -1.55 -1.44% |
| ROTTERDAM COAL MONTHLY | 121.10 | 121.10 121.10 | 0.70 0.58% |
| USD RBD PALM OLEIN | 1,175.00 | 1,175.00 1,175.00 | 0.00 0.00% |
| CRUDE OIL - WTI | 90.47 | 92.83 87.68 | -1.72 -1.87% |
| SUGAR #11 WORLD | 14.76 | 14.79 14.54 | 0.07 0.48% |
Chart of the Day
Latest News
Top 5 things to watch in this week
Pakistan Stock Movers
| Name | Last | Chg/%Chg |
|---|
| Name | Last | Chg/%Chg |
|---|