
Equities stay flat; Oil Prices continue upwards as OPEC delivers on cuts
MG News | December 04, 2017 at 12:14 AM GMT+05:00

Pakistan Stock Exchange – KSE100
During the last week ending Thursday, KSE-100 witnessed a total fall of 238.05 points during the week. After closing almost flat on Friday last week, the index opened the week on a negative note losing a total of 216 points on Monday.
Despite positive factors during the week as a result of a hugely successful bond auction of Sukuk and Eurobonds, the market remained negative.

The KSE-100 lost a total of 238.05 points during the week, with a close of 40248.41 on Friday last week and a close on 40010.36 points on Thursday.
NCCPL Data
By Investor
Banks/DFIs, Brokers, Companies, Individuals, Insurance Cos., Mutual Funds, and other organizations were net buyers throughout the week whereas Foreign Corporates sold their positions by 40 million in the market.

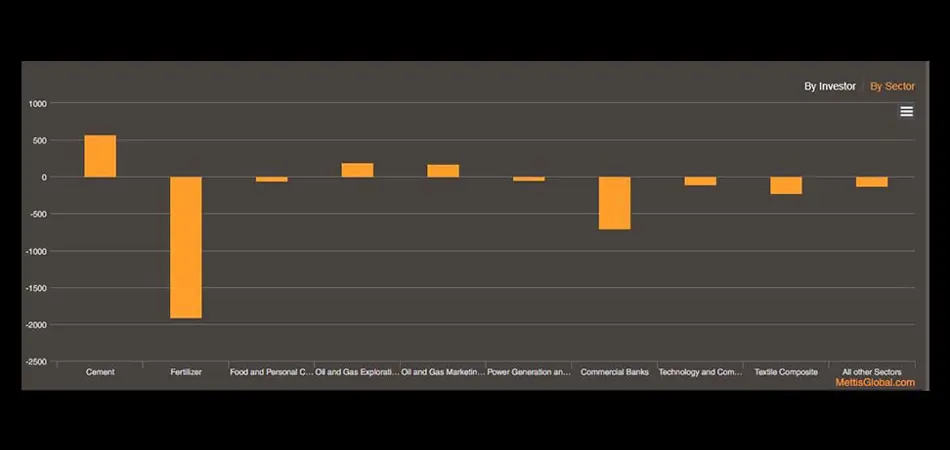
By Sector
Cement, Fertilizer Oil & Gas Marketing Companies and Oil & Gas Exploration Cos. were the pick of investors. Meanwhile, Fertilizer, Commercial Banks, and Textile Composite were the net losers from the ongoing negative sentiment in the market.

Weekly Reserves
The total liquid foreign reserves held by the country stood at US $ 19,693.2 million on 24 November 2017.
The break-up of the foreign reserves position is as under:-
| Reserves Position | ||||
|---|---|---|---|---|
| Foreign reserves held by | 24 Nov, 2017 | 17 Nov, 2017 | Change | % Change |
| State Bank of Pakistan | 13,547.30 | 13,541.1 | 6.20 | 0.05% |
| Net Foreign Reserves Held by Banks | 6,145.90 | 6,196.6 | -50.70 | -0.82% |
| Total Liquid Foreign Reserves | 19,693.20 | 19,710.70 | -17.50 | -0.09% |
During the week ending 24 November 2017, SBP’s reserves increased by US $ 6 million to US$13,547 million.
Weekly SPI
According to figures released by the Pakistan Bureau of Statistics, weekly SPI for the combined group increased by 0.04% compared to the previous week (Nov 23, 2017) and 1.40% compared to the corresponding period (Dec 01, 2017) last year.
| Sensitive Price Indicator Summary | |||
|---|---|---|---|
| Index | Nov 29, 2017 | Nov 23, 2017 | % Change |
| SPI Combined | 225.19 | 225.11 | 0.04 |
Of the 53 items monitored, the average weekly price of 10 items registered an increase, nine decreased while 34 remained unchanged.
Weekly Oil Prices – WTI & BRENT
OPEC followed through on its promise, extending the production cuts through the end of 2018, bringing relief to an oil market that had grown jittery in recent days. Oil prices traded in a relatively narrow range after the meeting and appeared muted. But once concerns over a selloff calmed, oil prices rallied once again on Friday morning.
OPEC deal extended through 2018. The deal will run from January through to December, and the exact volumes of the production cuts will be the same as this year. The OPEC/non-OPEC coalition said that they would monitor market conditions and would remain “agile,” ready to respond if the fundamentals deviate significantly from expectations. They will revisit the agreement at the next official meeting in June 2018, but they assume the cuts will last through the end of the year. Russian officials pressed for details on an exit strategy heading into the meeting, but the group offered no information – Saudi oil minister Khalid al-Falih said it would be “premature” to do so. One notable change is that Libya and Nigeria agreed to cap their production levels at their 2017 average, which doesn’t necessarily curtail supply but will prevent any “surprise,” as witnessed this year. The Russian and Saudi oil ministers played up their unity and boasted about their strong relationship. All smiles from Vienna.
| Weekly WTI & Brent Prices | |||||
|---|---|---|---|---|---|
| Benchmark | Nov 27, 2017 | Nov 28, 2017 | Nov 29, 2017 | Nov 30, 2017 | Nov 31, 2017 |
| WTI | 58.12 | 57.95 | 57.25 | 57.43 | 58.36 |
| BRENT | 63.38 | 63.24 | 62.53 | 62.63 | 63.46 |
WTI Month

BRENT Last month

Related News



| Name | Price/Vol | %Chg/NChg |
|---|---|---|
| KSE100 | 171,021.20 228.53M | -0.42% -718.25 |
| ALLSHR | 103,836.39 572.65M | -0.41% -422.85 |
| KSE30 | 50,951.99 89.47M | -0.52% -264.77 |
| KMI30 | 240,633.87 93.99M | -0.31% -756.80 |
| KMIALLSHR | 66,572.75 300.61M | -0.28% -185.59 |
| BKTi | 48,673.23 31.18M | -0.70% -343.86 |
| OGTi | 33,702.25 6.35M | -0.61% -205.57 |
| Symbol | Bid/Ask | High/Low |
|---|
| Name | Last | High/Low | Chg/%Chg |
|---|---|---|---|
| BITCOIN FUTURES | 64,510.00 | 64,550.00 63,875.00 | 295.00 0.46% |
| BRENT CRUDE | 98.70 | 101.19 95.13 | -1.99 -1.98% |
| RICHARDS BAY COAL MONTHLY | 105.75 | 0.00 0.00 | -1.55 -1.44% |
| ROTTERDAM COAL MONTHLY | 121.10 | 121.10 121.10 | 0.70 0.58% |
| USD RBD PALM OLEIN | 1,175.00 | 1,175.00 1,175.00 | 0.00 0.00% |
| CRUDE OIL - WTI | 90.47 | 0.00 0.00 | 1.16 1.30% |
| SUGAR #11 WORLD | 14.76 | 14.79 14.54 | 0.07 0.48% |
Chart of the Day
Latest News
Top 5 things to watch in this week
 Weekly SPI
Pakistan Stock Movers
| Name | Last | Chg/%Chg |
|---|
| Name | Last | Chg/%Chg |
|---|