
The higher oil climbs, the harder Pakistan’s market falls
MG News | May 25, 2026 at 02:29 PM GMT+05:00

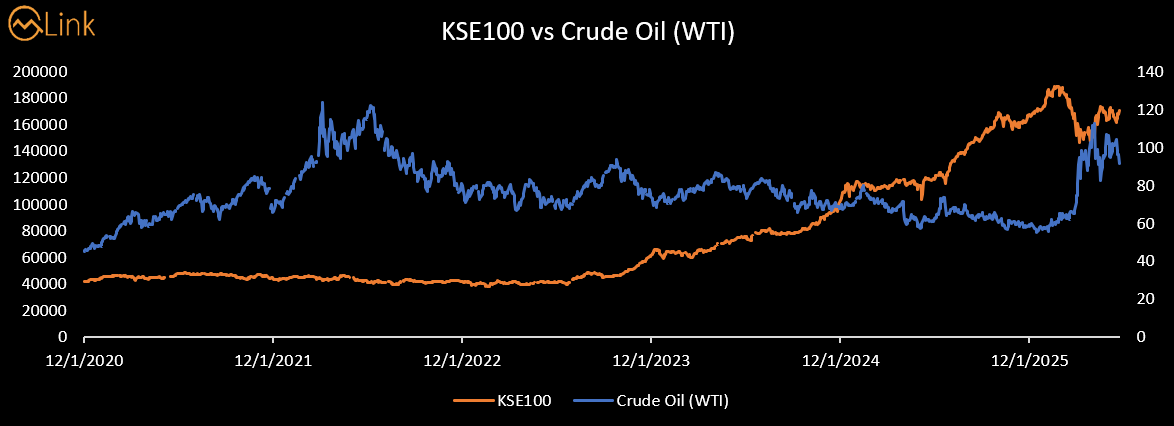
May 25, 2026 (MLN): The Pakistan Stock Exchange's benchmark KSE-100 index has delivered one of the most spectacular emerging-market returns of the past half-decade. Since December 2020, the index has gained more than 300%, transforming it into a global outlier at a time when most frontier and emerging markets struggled for momentum.
Yet behind that headline number lies a story.
The defining engine of Pakistan's bull run has been a remarkably consistent inverse relationship between global oil prices and domestic equities. Pakistan imports most of its energy needs.
When crude costs rise, the economy imports inflation, burns
through foreign exchange reserves, widens its current account deficit, and
forces interest rates higher, a cocktail that strangles the
equity risk premium and sends investors to the sidelines. When crude falls, the
opposite occurs with striking speed.
That logic played
out with textbook precision between 2022 and 2025. As West Texas Intermediate
(WTI) crude retreated from its post-Ukraine peak, Pakistani equities were
unleashed, crossing 100,000 points in 2024 and reaching a peak of 189,166 on
January 22, 2026.
The bull run was
not simply sentiment, it was macroeconomically grounded in
a genuine improvement in Pakistan's external account, inflation trajectory, and
real interest rates.
Today, that
runway has been violently cut short.
The escalating military standoff between Iran and the United States has injected a massive risk premium into global energy markets. Fear of disruptions to Strait of Hormuz shipping lanes triggered an oil price shock that pushed WTI from $58.64 in December 2025 to a peak of $112.41 per barrel in early April 2026, a 91.7% surge in just four months.
The KSE-100,
which had set an all-time high only week earlier, crashed 22.6% in response
before staging a partial recovery to its current level of 170,509.
Following table
tracks WTI crude oil and the KSE-100 at annual intervals from December 2020
through the present day, with key 2026 events highlighted.
|
Date |
WTI
(USD/bbl) |
WTI
Change |
KSE-100
Level |
KSE-100
Change |
Note |
|
Dec 1, 2020 |
$45.28 |
— |
42,027 |
— |
|
|
Dec 1, 2021 |
$66.50 |
+46.9% |
43,234 |
+2.9% |
|
|
Dec 1, 2022 |
$79.98 |
+76.6%* |
42,150 |
+0.3%* |
|
|
Dec 3, 2023 |
$73.04 |
-8.7% vs '22 |
62,493 |
+48.3% vs '22 |
|
|
Dec 1, 2024 |
$68.10 |
-14.8% vs '22 |
103,275 |
+144.8% vs '22 |
|
|
Dec 1, 2025 |
$58.64 |
-26.7% vs '22 |
167,642 |
+297.5% vs '22 |
|
|
Jan 22, 2026 |
$59.36 |
-25.8% vs '22 |
189,166 |
+348.7% vs '20 |
ALL TIME HIGH |
|
Apr 5-6, 2026 |
$112.41 |
+91.7% vs Dec'25 |
~151,000 |
-20.2% from ATH |
Oil
Peak
in 2026 |
|
May
24, 2026 |
$91.53 |
+56.1% vs Dec'25 |
170,509 |
+1.7% vs Dec'25 |
|
*
WTI Change and KSE-100 Change in rows for Dec 2021 and Dec 2022 are measured
from Dec 1, 2020 baseline. Subsequent rows show change versus Dec 2022 (Phase 2
baseline) unless otherwise noted. Oil peak of $112.41 was reached on April 5-6,
2026.
Phase
Summary: Three Acts of a Decade-Defining Divergence
|
Phase |
Period |
WTI
Move |
KSE-100
Move |
|
Phase
1 |
Dec 2020 – Dec
2022 |
$45.28 →
$79.98 (+76.6%) |
42,027 →
42,150 (+0.3%) |
|
Phase
2 |
Dec 2022 – Dec
2025 |
$79.98 →
$58.64 (-26.7%) |
42,150 →
167,642 (+297.5%) |
|
Phase
3 |
Dec 2025 – May
2026 |
$58.64 →
$112.41 peak (+91.7%) |
167,642 →
170,509 (+1.7%) |
Phase
1 (Dec 2020 – Dec 2022):
The KSE-100 sat
at 42,027 in December 2020, and the subsequent two years would prove to be an
exercise in frustration for equity investors. As WTI crude climbed steadily
from $45.28 to $66.50 by December 2021, and then to $79.98 by December 2022, a cumulative rise of 76.6% the macroeconomic environment for Pakistan
deteriorated markedly.
Critically, this
table does not capture the full severity of the 2022 oil shock. In the wake of
Russia's invasion of Ukraine, WTI crude reached approximately $120 per barrel
in June 2022 before retreating. At those levels, Pakistan's monthly import bill
ballooned, its foreign exchange reserves fell to dangerously low levels, and
the Pakistan Rupee came under severe pressure.
Against this
backdrop, the KSE-100 effectively flatlined, ending December 2022 at 42,150, a gain of just 0.3% over two years. Capital
did not flee outright, but it refused to commit.
Phase
2 (Dec 2022 – Dec 2025):
The inflection
point came as global oil markets cooled and Pakistan's macroeconomic
stabilization program began to take hold. As WTI retreated from its 2022 highs falling to $73.04 by December 2023, then
$68.10 by December 2024, and finally $58.64 by December 2025 the pressure on Pakistan's external account
evaporated with remarkable speed.
This was not oil
alone. The International Monetary Fund's Extended Fund Facility provided a
critical policy anchor, restoring investor confidence in Pakistan's fiscal
trajectory.
The State Bank of
Pakistan began an aggressive rate-cutting cycle as inflation moderated from its
2023 peak. The Pakistani Rupee stabilized. With real interest rates turning
more favourable and external account pressures easing, capital rotated
aggressively into Pakistani equities.
The KSE-100's
trajectory in this period was extraordinary. From 42,150 in December 2022, the
index reached 62,493 by December 2023, a 48.3% gain driven largely by
normalizing macro conditions.
By December 2024,
it had crossed the historic 100,000-point barrier to reach 103,275, an
additional 65.3% gain.
And by December
2025, with WTI at its lowest point in years, the KSE-100 stood at 167,642, up
297.5% from its Phase 1 endpoint. It was one of the strongest multi-year equity
rallies recorded in any major emerging market.
Phase
3 (2026):
The KSE-100
entered 2026 with extraordinary momentum. In the first weeks of January, as WTI
remained subdued near $57–59 per barrel, the index surged to an all-time high
of 189,166 on January 22, 2026. At that level, the KSE-100 had gained 348.7%
from its December 2020 starting point. Investor sentiment was euphoric; the
consensus expected the index to cross 200,000 before mid-year.
The rupture came
swiftly and without warning. In the final days of February and first week of
March 2026, news of military hostilities between Iran and the United States
sent shockwaves through global energy markets.
In just five
trading sessions between February 26 and March 5, WTI crude surged from $67 to
$90.90 per barrel, a 35% spike that immediately recalibrated
Pakistan's entire macroeconomic outlook. By March 8, with WTI at $94.77, the
KSE-100 had crashed to 146,480, erasing 22.6% from its all-time high in under
six weeks.
The months that
followed were defined by extreme volatility tied directly to oil price
movements. When WTI briefly retreated to $82.59 on April 16, the KSE-100
bounced sharply to 173,939, briefly recovering above December 2025 levels.
When oil climbed
again toward $106-107 in late April and early May, the index tumbled back below
166,000. Each swing in crude produced an almost mirror-image move in Pakistan within
days compressing what had been an annual-timescale macro relationship
into a near-daily oscillation.
WTI crude reached
its peak of $112.41 on April 5-6, 2026, at which point the KSE-100 had fallen
to approximately 151,000, a 20.2% drop from its all-time high. As of May 24,
2026, with WTI settling at $91.53, the index has stabilized at 170,509 up a mere 1.7% since December 2025, versus
oil's 56.1% surge over the same period. The bull market has not broken, but it
is pinned.
The KSE-100's
near-term trajectory is now almost entirely a function of geopolitics rather
than domestic fundamentals. Two distinct scenarios define the path ahead.
In a
de-escalation scenario, a ceasefire or diplomatic
settlement between Iran and the United States, WTI could retreat meaningfully
toward the lower range, reopening the macroeconomic runway that drove the
2023-2025 bull run.
Under those
conditions, the KSE-100's all-time high of 189,166 would come quickly back into
view, and a move toward 200,000 would be realistic. Pakistan's improving fiscal
position, ongoing IMF support, and a benign interest rate environment would
once again dominate the investment narrative.
In an
entrenchment scenario where the conflict persists and oil sustains above $90
per barrel the calculus changes fundamentally. Pakistan's monthly petroleum
import bill would balloon, foreign exchange reserves would face renewed
pressure, and the State Bank of Pakistan would be constrained from continuing
its rate-cutting cycle.
The Monetary Policy Committee had
decided to increase the policy rate by 100 bps to 11.5% in its meeting held on
April 27, 2026, marking the first rate increase in nearly three years, since
the emergency hike to 22% in June 2023.
Inflation
expectations would be revised upward. Corporate earnings forecasts across the
cement, automobile, energy, and consumer sectors would be cut. In that
environment, investor risk appetite would erode and the KSE-100's hard-won
gains above 170,000 could come under sustained pressure.
As it stands, the market may be
getting the relief it desperately needed. Today, the benchmark KSE-100 opened
the week on a strong positive note, climbing 3,611.88 points to reach
171,456.12, after President Donald Trump revealed that the critical Strait of
Hormuz will be reopened as part of a sweeping Middle East peace agreement on
the verge of formation, following intensive Oval Office negotiations with
regional leaders, which caused West Texas Intermediate (WTI) crude futures to
fall by 5.66%, to $90.94.
Copyright Mettis
Link News
Related News

_20261009161631180_9d2ce0.jpeg?width=280&height=140&format=Webp)
_20260518072716198_9300ef.jpeg?width=280&height=140&format=Webp)
| Name | Price/Vol | %Chg/NChg |
|---|---|---|
| KSE100 | 167,089.28 109.91M | -0.21% -352.63 |
| ALLSHR | 101,117.40 308.32M | -0.15% -155.10 |
| KSE30 | 49,841.71 50.59M | -0.28% -142.15 |
| KMI30 | 240,372.43 78.75M | -0.02% -45.72 |
| KMIALLSHR | 65,518.16 188.07M | -0.05% -35.70 |
| BKTi | 46,228.77 7.60M | -0.60% -281.04 |
| OGTi | 33,974.66 4.20M | -0.27% -91.31 |
| Symbol | Bid/Ask | High/Low |
|---|
| Name | Last | High/Low | Chg/%Chg |
|---|---|---|---|
| BITCOIN FUTURES | 83,875.00 | 84,320.00 82,645.00 | 1405.00 1.70% |
| BRENT CRUDE | 104.54 | 105.09 102.33 | 0.26 0.25% |
| RICHARDS BAY COAL MONTHLY | 128.50 | 0.00 0.00 | 0.75 0.59% |
| ROTTERDAM COAL MONTHLY | 143.40 | 143.40 143.40 | -1.15 -0.80% |
| USD RBD PALM OLEIN | 1,167.50 | 1,167.50 1,167.50 | 0.00 0.00% |
| CRUDE OIL - WTI | 91.66 | 0.00 0.00 | -0.19 -0.21% |
| SUGAR #11 WORLD | 20.27 | 20.44 20.09 | 0.12 0.60% |
Chart of the Day
Latest News
Top 5 things to watch in this week
 PIB Auction
Pakistan Stock Movers
| Name | Last | Chg/%Chg |
|---|
| Name | Last | Chg/%Chg |
|---|