

March 01, 2026 (MLN): February 2026 turned into a brutal reality check for the red-hot rally that had been pulling in fresh investors for months. The benchmark KSE-100 Index plunged 16,112 points or 8.7% month-on-month, closing at 168,062.17 compared with 184,174.49 at the end of January.
The sharp correction erased a significant portion of recent gains and triggered widespread panic selling across the market.
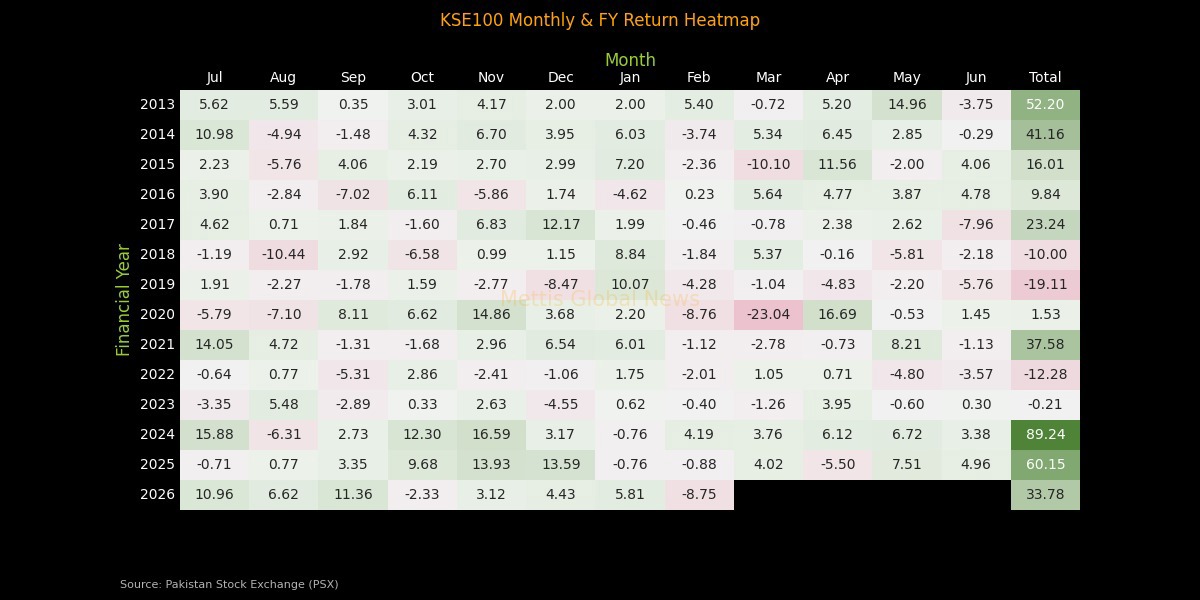
After seven consecutive months of uninterrupted gains, an extraordinary run that saw the index jump by double digits in July and September, the market finally succumbed to the weight of its own success.
The -8.75% decline in February stands out as a stark contrast to the sea of green that preceded it, representing a healthy, albeit painful, "cool down" period.
Yet, when viewed through the lens of the entire financial year, this correction appears as a mere footnote in a larger success story with a total fiscal year return of 33.78% still on the books.
This steepest monthly fall since March 2020 was due to a toxic mix of geopolitical escalation, persistent foreign outflows, disappointing corporate earnings in select heavyweights, and uncertainty surrounding the Reko Diq project.
Rising global commodity prices, particularly oil and gold, further clouded the outlook for a net-importing economy like Pakistan, which amplified fears of higher inflation, squeezed corporate margins, and policy tightening risks.
Macroeconomic developments provided little relief. Inflation remained relatively contained at 5.8% YoY for January, and the country posted a modest current account surplus of $121 million for the month.
Geopolitical uncertainty dominated investor psychology. Pakistan-Afghanistan tension and escalation in the Middle East that may disrupt oil supply routes and airspace across the region.
The shift in market structure also coincided with operational changes. The transition of the settlement cycle from T+2 to T+1 aimed to modernize the capital market, but during periods of volatility, such shifts can exacerbate liquidity stress and forced selling.
_20260301055100262_e58b12.jpeg)
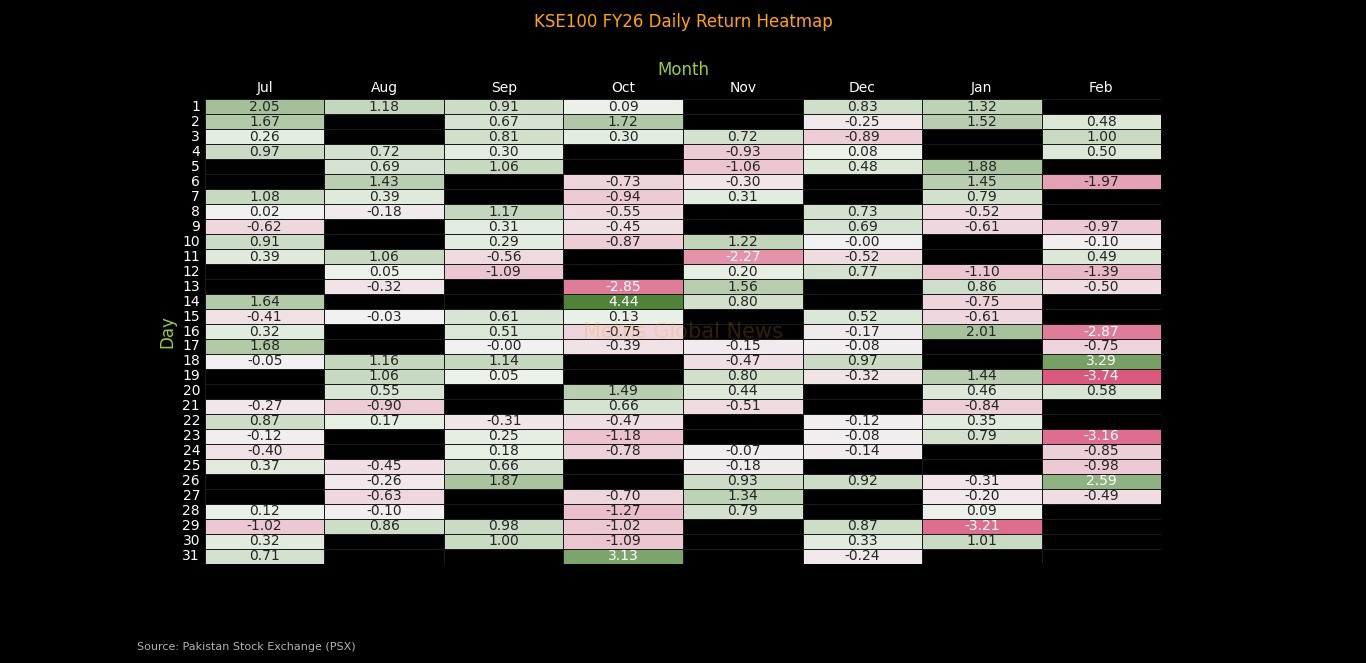
The Daily Pulse of February
The journey through February 2026 began with a sense of cautious stability, as the KSE-100 index initially traded in a tight range, seemingly catching its breath after a relentless seven-month rally.
However, as the month progressed, the Daily Return Heatmap reveals a shifting tide where the "green shoots" of January were replaced by a series of deep crimson sessions.
The market narrative took a sharp turn between February 19th and 23rd, where back-to-back hits of -3.74% and -3.16% signaled a wave of aggressive profit-taking and panic selling.
Just as the sentiment reached a tipping point, the month concluded with a dramatic plot twist on February 26th, when a sudden +2.59% surge provided a much-needed technical bounce.
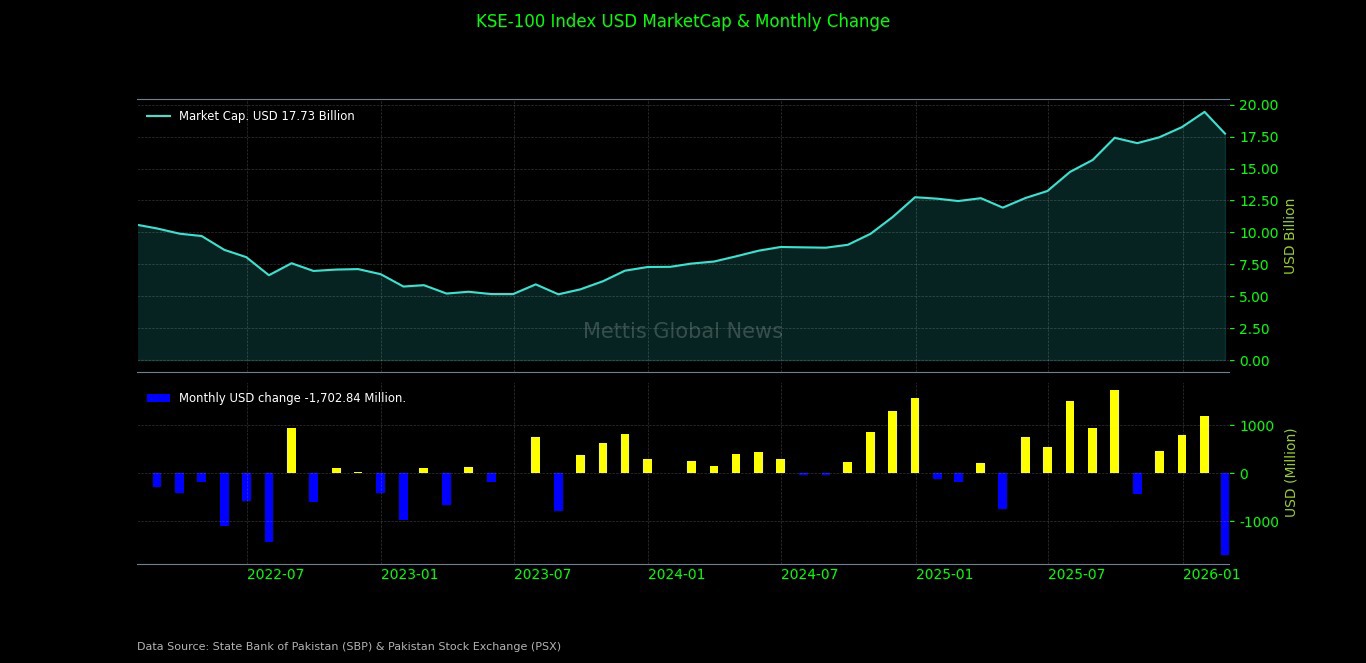
Market Capitalization
Market capitalization shrank sharply during the month, mirroring the index collapse. In rupee terms, total market value fell to Rs4.956 trillion from Rs5.438 trillion in January, representing a decline of approximately 8.9% MoM.
Despite the steep monthly drop, the figure remained about 42.3% higher than February 2025, when market capitalization stohod at Rs3.483 trillion, highlighting how powerful the preceding bull run had been.
In dollar terms, market capitalization dropped to $17.73 billion from $19.44 billion in the previous month, a fall of roughly 8.8% MoM.
On a yearly basis, however, the market was still up about 42.4% compared with $12.45 billion in February 2025, reflecting substantial foreign-exchange-adjusted gains over the past year.
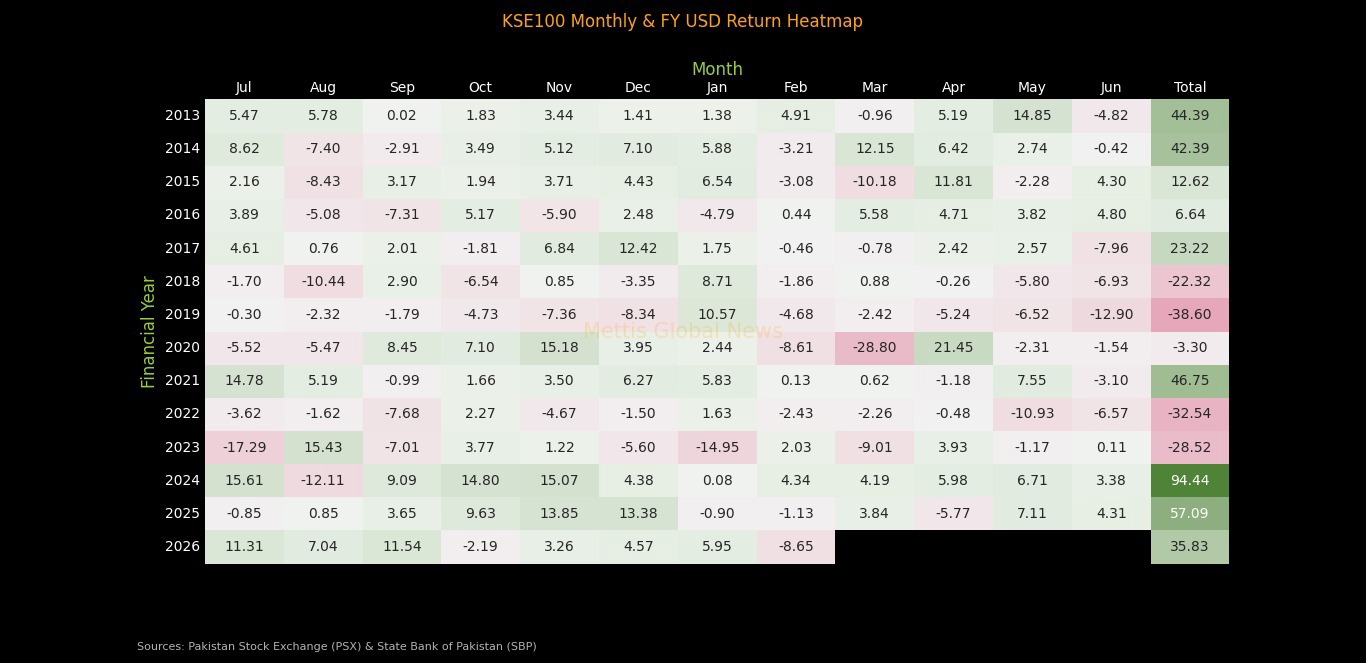
USD Return
Dollar-based returns mirrored the local decline. February delivered a negative USD return of 8.65%, which was a dramatic reversal from the positive 5.94% recorded in January. Meanwhile, in February 2025, the USD return was only −1.13%.
Currency stability offered only marginal comfort. The exchange rate stood at PKR 279.47 per dollar, slightly stronger than January’s 279.77 and broadly unchanged from February 2025’s 279.67.
The modest 0.1% MoM appreciation indicates that the equity sell-off was largely driven by domestic and global risk factors rather than by currency weakness.
_20260301055041405_ad85fc.jpeg)
Despite this monthly setback, the overarching story remains one of immense wealth creation; even with the February dip, the fiscal year-to-date return in USD stands at a staggering 35.83%.
This puts FY26 on a trajectory to potentially rival the historic bull runs of FY24 and FY25, reassuring global fund managers that the long-term structural uptrend remains intact despite the short-term volatility.
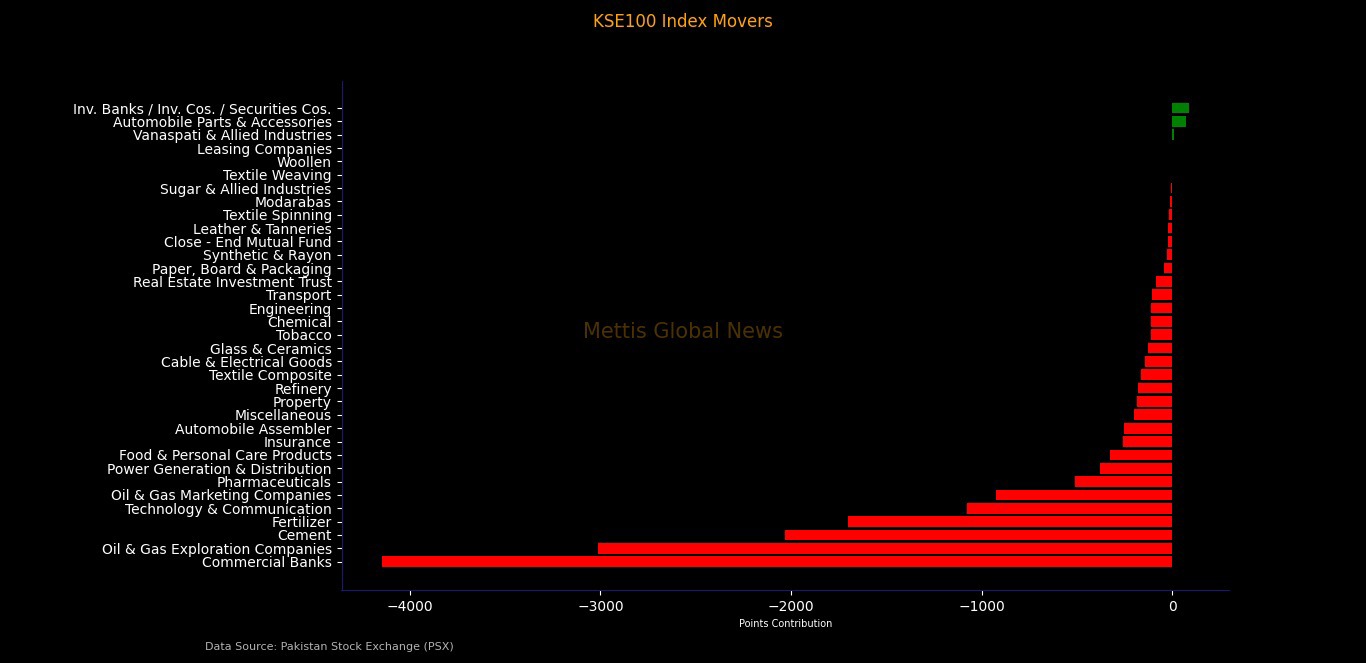
Index Movers
Sectoral performance revealed widespread damage across the board, with heavyweights bearing the brunt, with large-cap sectors alone dragging the index down by thousands of points.
Commercial banks were the biggest culprit, slicing over 4,100 points off the index amid profit-taking, concerns about future interest-rate trajectories, and foreign selling.
Oil and gas exploration companies followed, shedding more than 3,000 points as uncertainty around energy prices, security issues, and project risks weighed on sentiment.
Cement stocks removed over 2,000 points, reflecting concerns about construction demand and cost pressures, while fertilizer companies subtracted more than 1,700 points amid weak offtake data and earnings worries.
Technology and communication stocks, once market darlings, also came under heavy selling pressure.
Oil & Gas Marketing Companies pulled the index down by 923 points, while Pharmaceuticals removed 510 points.
Power Generation & Distribution contributed a negative 377 points, despite recording one of the highest traded volumes during the month, suggesting institutional repositioning rather than retail panic.
Food & Personal Care Products erased 327 points, Insurance deducted 257 points, and Automobile Assemblers reduced the index by 254 points.
Even smaller sectors participated in the drawdown. Property dragged 184 points, Refineries shaved 179 points, Textile Composite cut 163 points, and Cable & Electrical Goods removed 140 points. Transport deducted 107 points, REITs removed 84 points, while Tobacco lost 111 points.
Only three sectors posted positive marginal contributions. Vanaspati & Allied Industries added 8.8 points, Automobile Parts & Accessories contributed 71 points, and Investment Banks / Securities Companies added 88.8 points.
However, these gains were negligible compared to the thousands of points erased by banks, exploration, cement, and fertilizer.
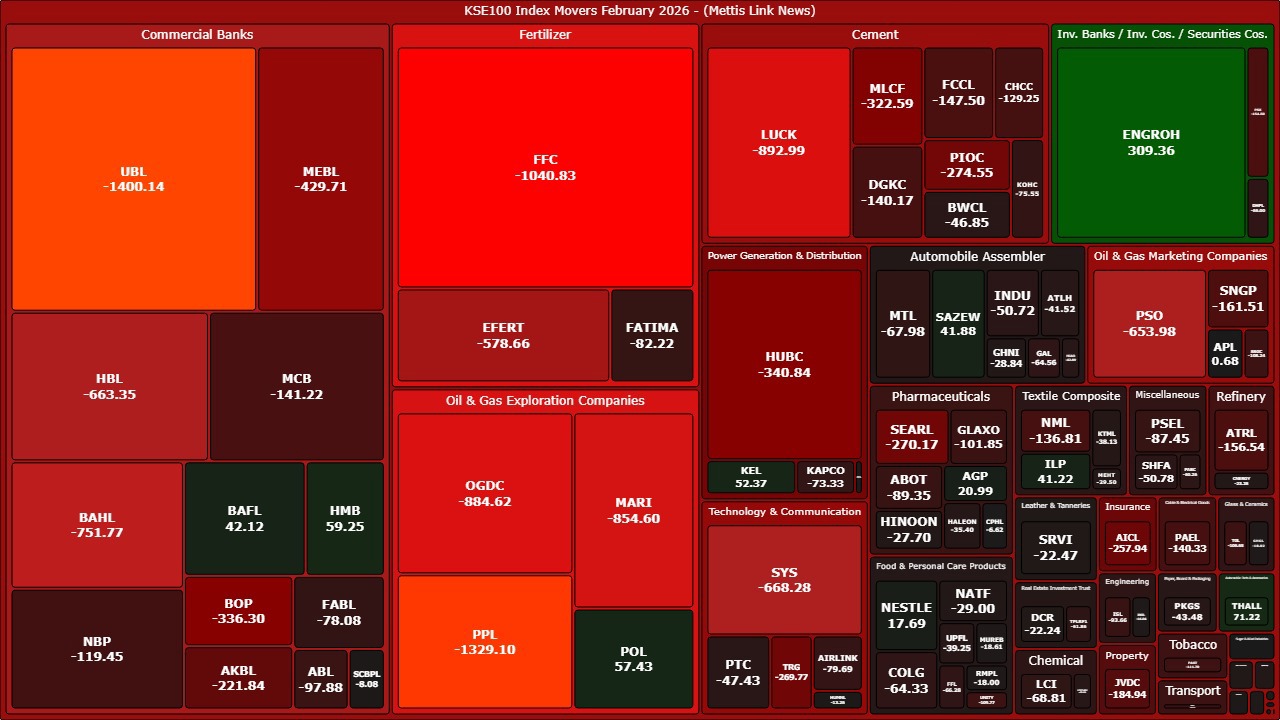
Major Scrips
At the stock level, UBL alone erased a massive 1,400 points, making it the single largest negative contributor. PPL followed with -1,329 points, while FFC wiped out -1,040 points.
Cement giant LUCK removed -892 points, and OGDC deducted -884 points. MARI cut -854 points, BAHL slashed -751 points, and SYS erased -668 points.
HBL removed -663 points, PSO shaved -653 points, and EFERT deducted -578 points. MEBL knocked off -429 points, HUBC removed -340 points, and BOP deducted -336 points.
Cement names continued their damage with MLCF erasing -322 points, PIOC cutting -274 points, DGKC deducting -140 points, FCCL removing -147 points, and CHCC shaving -129 points.
Technology stock TRG alone erased -269 points, while pharmaceutical name SEARL deducted -270 points. Insurance heavyweight AICL removed -257 points. AKBL slashed -221 points, and Property stock JVDC deducted -184 points.
Energy chain weakness was visible across ATRL (-156 points), SNGP (-161 points), SSGC (-108 points), and PIBTL (-107 points). Cable & Electrical Goods stock PAEL erased -140 points.
Similarly, exploration and fertilizer giants, PPL (-1,329), FFC (-1,040), OGDC (-884), MARI (-854), EFERT (-578), collectively accounted for a massive chunk of February’s 16,112-point decline.
Among the biggest positive contributors, ENGROH added 309 points, emerging as the strongest individual supporter. THALL contributed 71 points, HMB added 59 points, POL provided 57 points, and KEL added 52 points.
BAFL supported the index by 42 points, while SAZEW and ILP added 41 points each. AGP contributed 20 points, and NESTLE added nearly 18 points.
FIPI / LIPI Activity
Foreign investors remained aggressive sellers throughout the month as net Foreign Portfolio Investment (FIPI) recorded an outflow of $278.95 million, driven almost entirely by foreign corporates, which alone sold equities worth $280.70 million.
Foreign individuals were marginal sellers with a net outflow of about $0.18 million, while Overseas Pakistanis provided limited support with a net inflow of $1.93 million.
On the domestic front, local investors stepped in decisively. Net Local Portfolio Investment (LIPI) posted an inflow of $278.95 million, effectively absorbing the entire foreign selling pressure.
The largest buying came from local companies, which injected $221.36 million into the market, followed by Mutual Funds with purchases of $45.20 million and Banks/DFIs contributing $34.94 million.
Other organizations added $4.69 million, NBFCs provided $0.38 million, and individuals remained marginal buyers at just $0.05 million.
However, not all domestic participants were buyers. Insurance companies recorded net sales of $14.20 million, while broker proprietary trading desks offloaded equities worth $13.46 million.
_20260301055034365_7bcce9.jpeg)
Macro Undercurrents
While equities bled, Pakistan’s macro data presented a mixed picture.
Inflation remained relatively contained, with CPI clocking in at 5.8% YoY in January 2026, slightly higher than 5.6% in December 2025.
On the external front, Pakistan recorded a current account surplus of $121 million in January 2026, a significant turnaround compared to a $393 million deficit in January 2025 and a $265 million deficit in December 2025.
Remittances remained a stabilizing pillar. In January 2026 alone, inflows reached $3.5 billion, marking a 15% YoY increase, although declining 4% MoM.
Foreign Direct Investment stood at $173 million in January 2026, slightly higher than $135 million in December 2025.
Meanwhile, Central Government debt climbed 1.3% MoM to Rs78.5 trillion, reflecting a 9.6% YoY increase compared to Rs71.6 trillion in December 2024.
Large Scale Manufacturing (LSMI) offered a modest positive surprise, growing 0.4% YoY in December 2025 and surging 9.3% MoM.
OMC sales rose 12% MoM and 10% YoY in January 2026 to 1.52 million tons, with cumulative 7MFY26 offtake up 3% YoY to 9.67 million tons, suggesting gradual demand recovery.
Automobile sales delivered exceptional growth, surging 74% MoM and 36% YoY to 23,100 units.
However, fertilizer demand painted a different story. Fertilizer consumption in Pakistan witnessed weaker performance in January 2026, as overall nutrient offtake decreased by 48% year-on-year to 151,000 tonnes.
Despite market turbulence, structural reforms continued.
The Economic Coordination Committee also revised the Mera Ghar Mera Aashiana housing scheme, raising the loan cap to Rs10 million and introducing a uniform 5% end-user pricing structure.
Meanwhile, high-level discussions between multinational CEOs and an IMF delegation emphasized the urgent need to transition from macro stabilization to sustained, export-led growth.
February 2026 will be remembered as the month when optimism collided with reality, wherein the powerful rally built on improving macro indicators met geopolitical shocks, policy uncertainties, and profit-taking.
The path forward now hinges on geopolitical developments, foreign flows, and corporate earnings recovery.


