July 09, 2023 (MLN): The following is an outlook for the KSE-100 index based on technical analysis (historical quantitative data).
KSE-100 Weekly time-frame chart

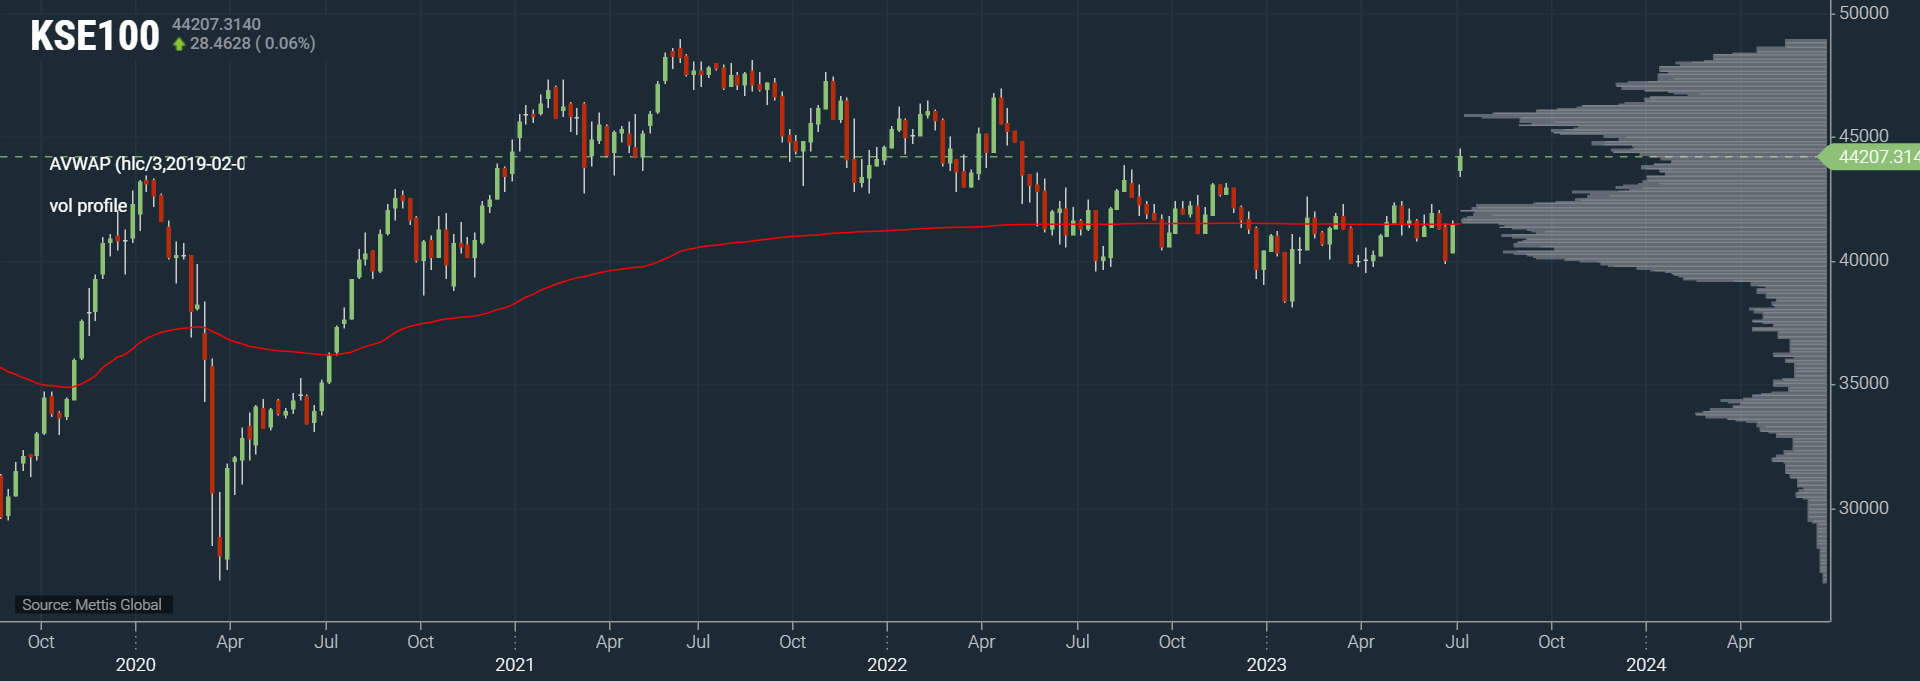
KSE-100 Daily time-frame chart

| Support Levels | ||
|---|---|---|
| 43,800 | 43,594 | 43,200 |
| S1 | S2 | S3 |
| Resistance Levels | ||
|---|---|---|
| 44,500 | 45,000 | 45,400 |
| R1 | R2 | R3 |
The benchmark KSE-100 Index closed Friday’s trading session at 44,207.31 points.
KSE-100 recorded the second-highest weekly return after April 03, 2020, registering an increase of 6.6% WoW or 2,755 pts, while in USD terms it gained of 9.75%.
Average volumes arrived at 340m shares, up by 47% compared with last week, and the average value traded settled at $41m, up by 63%
KSE-100 finally broke out of the 12-month range (39,800 – 43,200pts), the next point of control (POC) is around 45,000, which should serve as a strong resistance.
For those already in positions, profit taking is recommended around 44,500-45,000pts area.
For those looking to build positions, waiting for a pullback towards the support zones (43,800 – 43,200pts) which was the range high of the above mentioned range, is recommended.
Stop losses are recommended on acceptance back inside the range, which would indicate deviation of the range.
Short-term technical indicators are giving a buy stance. Additionally, the Moving Average Convergence Divergence (MACD) is bullish as it is trading above its signal line. The MACD crossed above its signal line five trading sessions ago. Since the MACD crossed its moving average, the Index has increased 1.2%.
| Indicator | Value | Stance |
|---|---|---|
| Exponential Moving Average (10) | 42847.91 | Buy |
| Simple Moving Average (10) | 42272.3 | Buy |
| Exponential Moving Average (20) | 42211.76 | Buy |
| Simple Moving Average (20) | 41861.86 | Buy |
| Exponential Moving Average (30) | 41938.53 | Buy |
| Simple Moving Average (30) | 41696.74 | Buy |
| Exponential Moving Average (50) | 41651.57 | Buy |
| Simple Moving Average (50) | 41628.53 | Buy |
| Exponential Moving Average (100) | 41389.18 | Buy |
| Simple Moving Average (100) | 41228.71 | Buy |
| Exponential Moving Average (200) | 41524.33 | Buy |
| Relative Strength Index (14) | 72.07 | Sell |
| Stochastic %K (14, 3, 3) | 93.75 | Strong Sell |
| Ultimate Oscillator (7, 14, 28) | 65.25 | Neutral |
| Hull Moving Average (9) | 44722.79 | Sell |

Technical terms used:
Moving average (MA): A calculation that takes the arithmetic mean of a given set of prices over a specific number of days in the past.
Exponential moving average (EMA): A weighted average that gives greater importance to the price of a stock in more recent days, making it an indicator that is more responsive to new information.
Hull Moving Average (HMA): It measures the average price of an asset over a period of time.
Volume weighted average price (VWAP): It is just a moving average but puts Volume into the calculation.
Point of control (POC): It is the price level at which the greatest number of contracts are traded during a given trading period.
Relative strength index (RSI): It compares a security’s strength on days when prices go up to its strength on days when prices go down.
Moving Average Convergence Divergence: It is a trend-following momemtum indicator that shows the relationship between two EMAs of a security’s price. The MACD line is calculated by subtracting the 26-period EMA from the 12-period EMA.
High Volume Node (HVN): It refers to the price at which the largest amount of volume occurred.
Disclaimer: The opinions in this article are the author’s and do not necessarily represent the views of Mettis Link News (MLN).
Copyright Mettis Link News
Posted on: 2023-07-09T21:08:23+05:00