Overbought KSE-100: A False Alarm or a Warning Signal?

Abdur Rahman | November 12, 2023 at 07:28 PM GMT+05:00

November 12, 2023 (MLN): The benchmark KSE-100 index 14-day relative strength index (RSI) has breached the 90 level for the first time since March 2005.
The RSI is a widely tracked measure of momentum, and experts have termed the KSE-100 to be in "overbought" territory.
However, this does not necessarily mean that the market is due for a correction.
To understand this better, let's look at some historical scenarios.
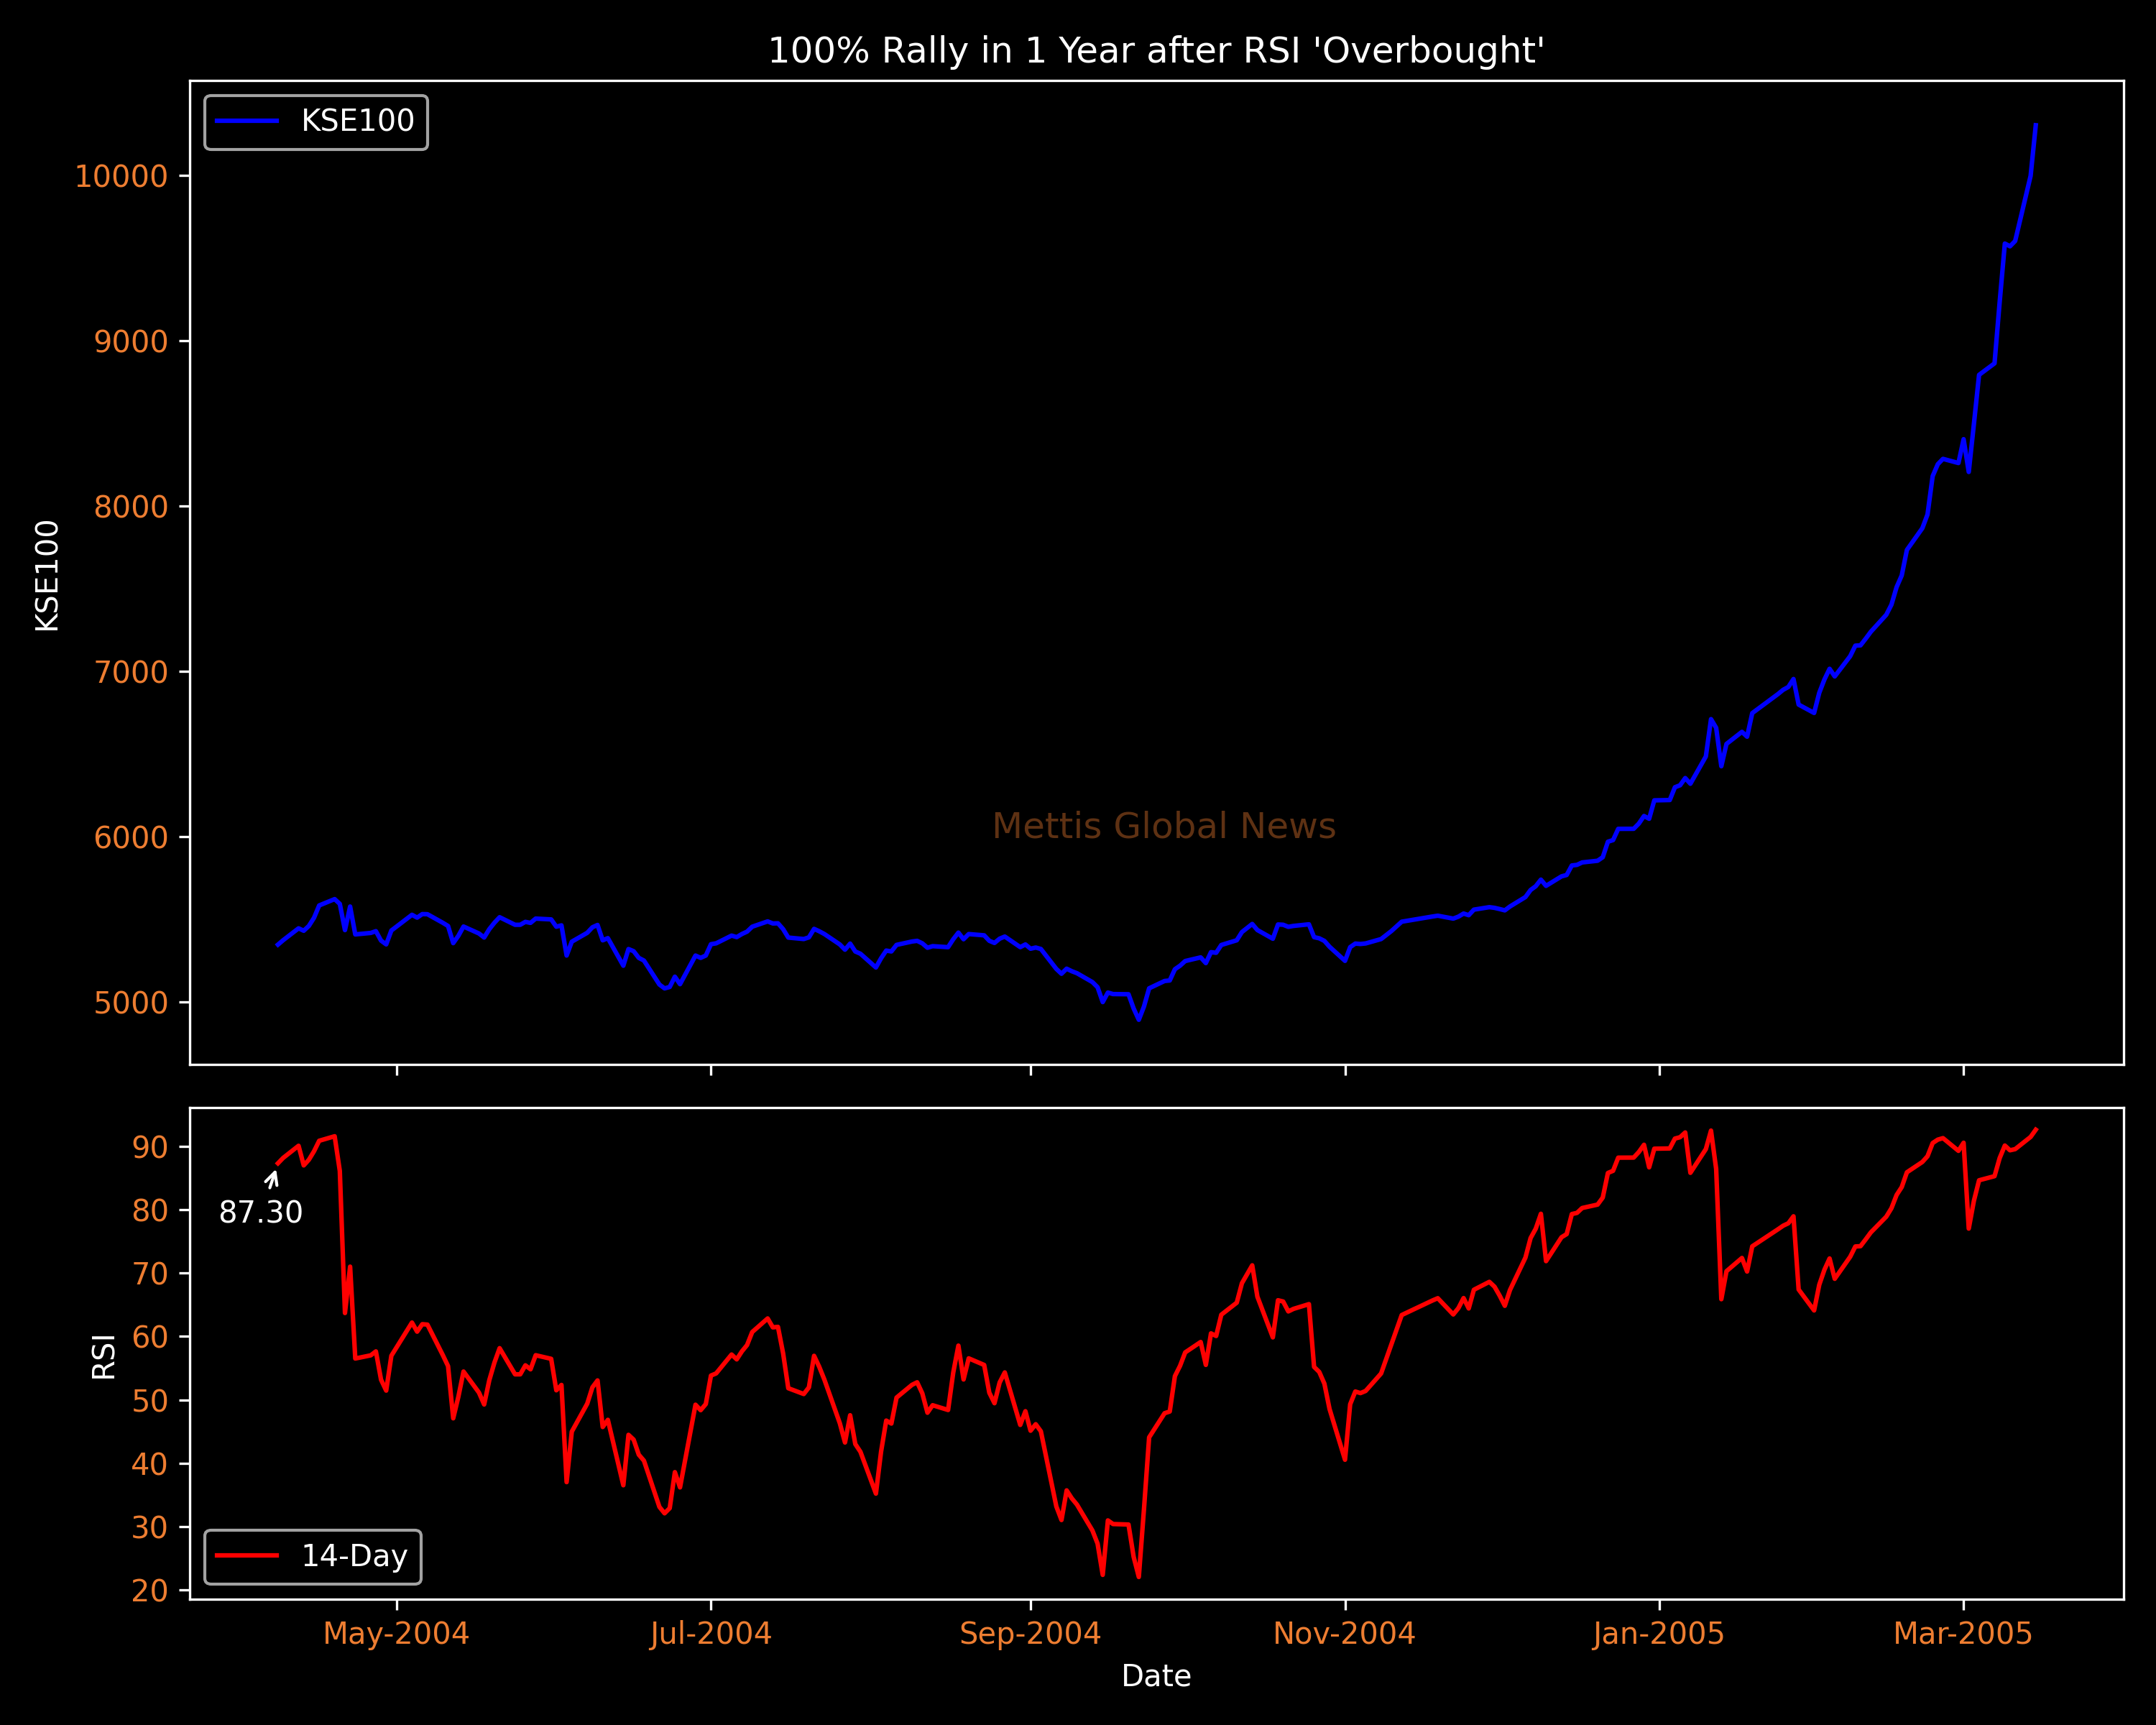
In April 2004, the RSI rose above 87, indicating a highly overbought condition.
However, zooming out on the chart, we see that the KSE-100 index increased by a staggering 100% over the next year.
Despite the RSI reaching 85-90 several times in between, the market managed to sustain its upward momentum.
A similar pattern can be observed the last time the index reached a very high RSI level.
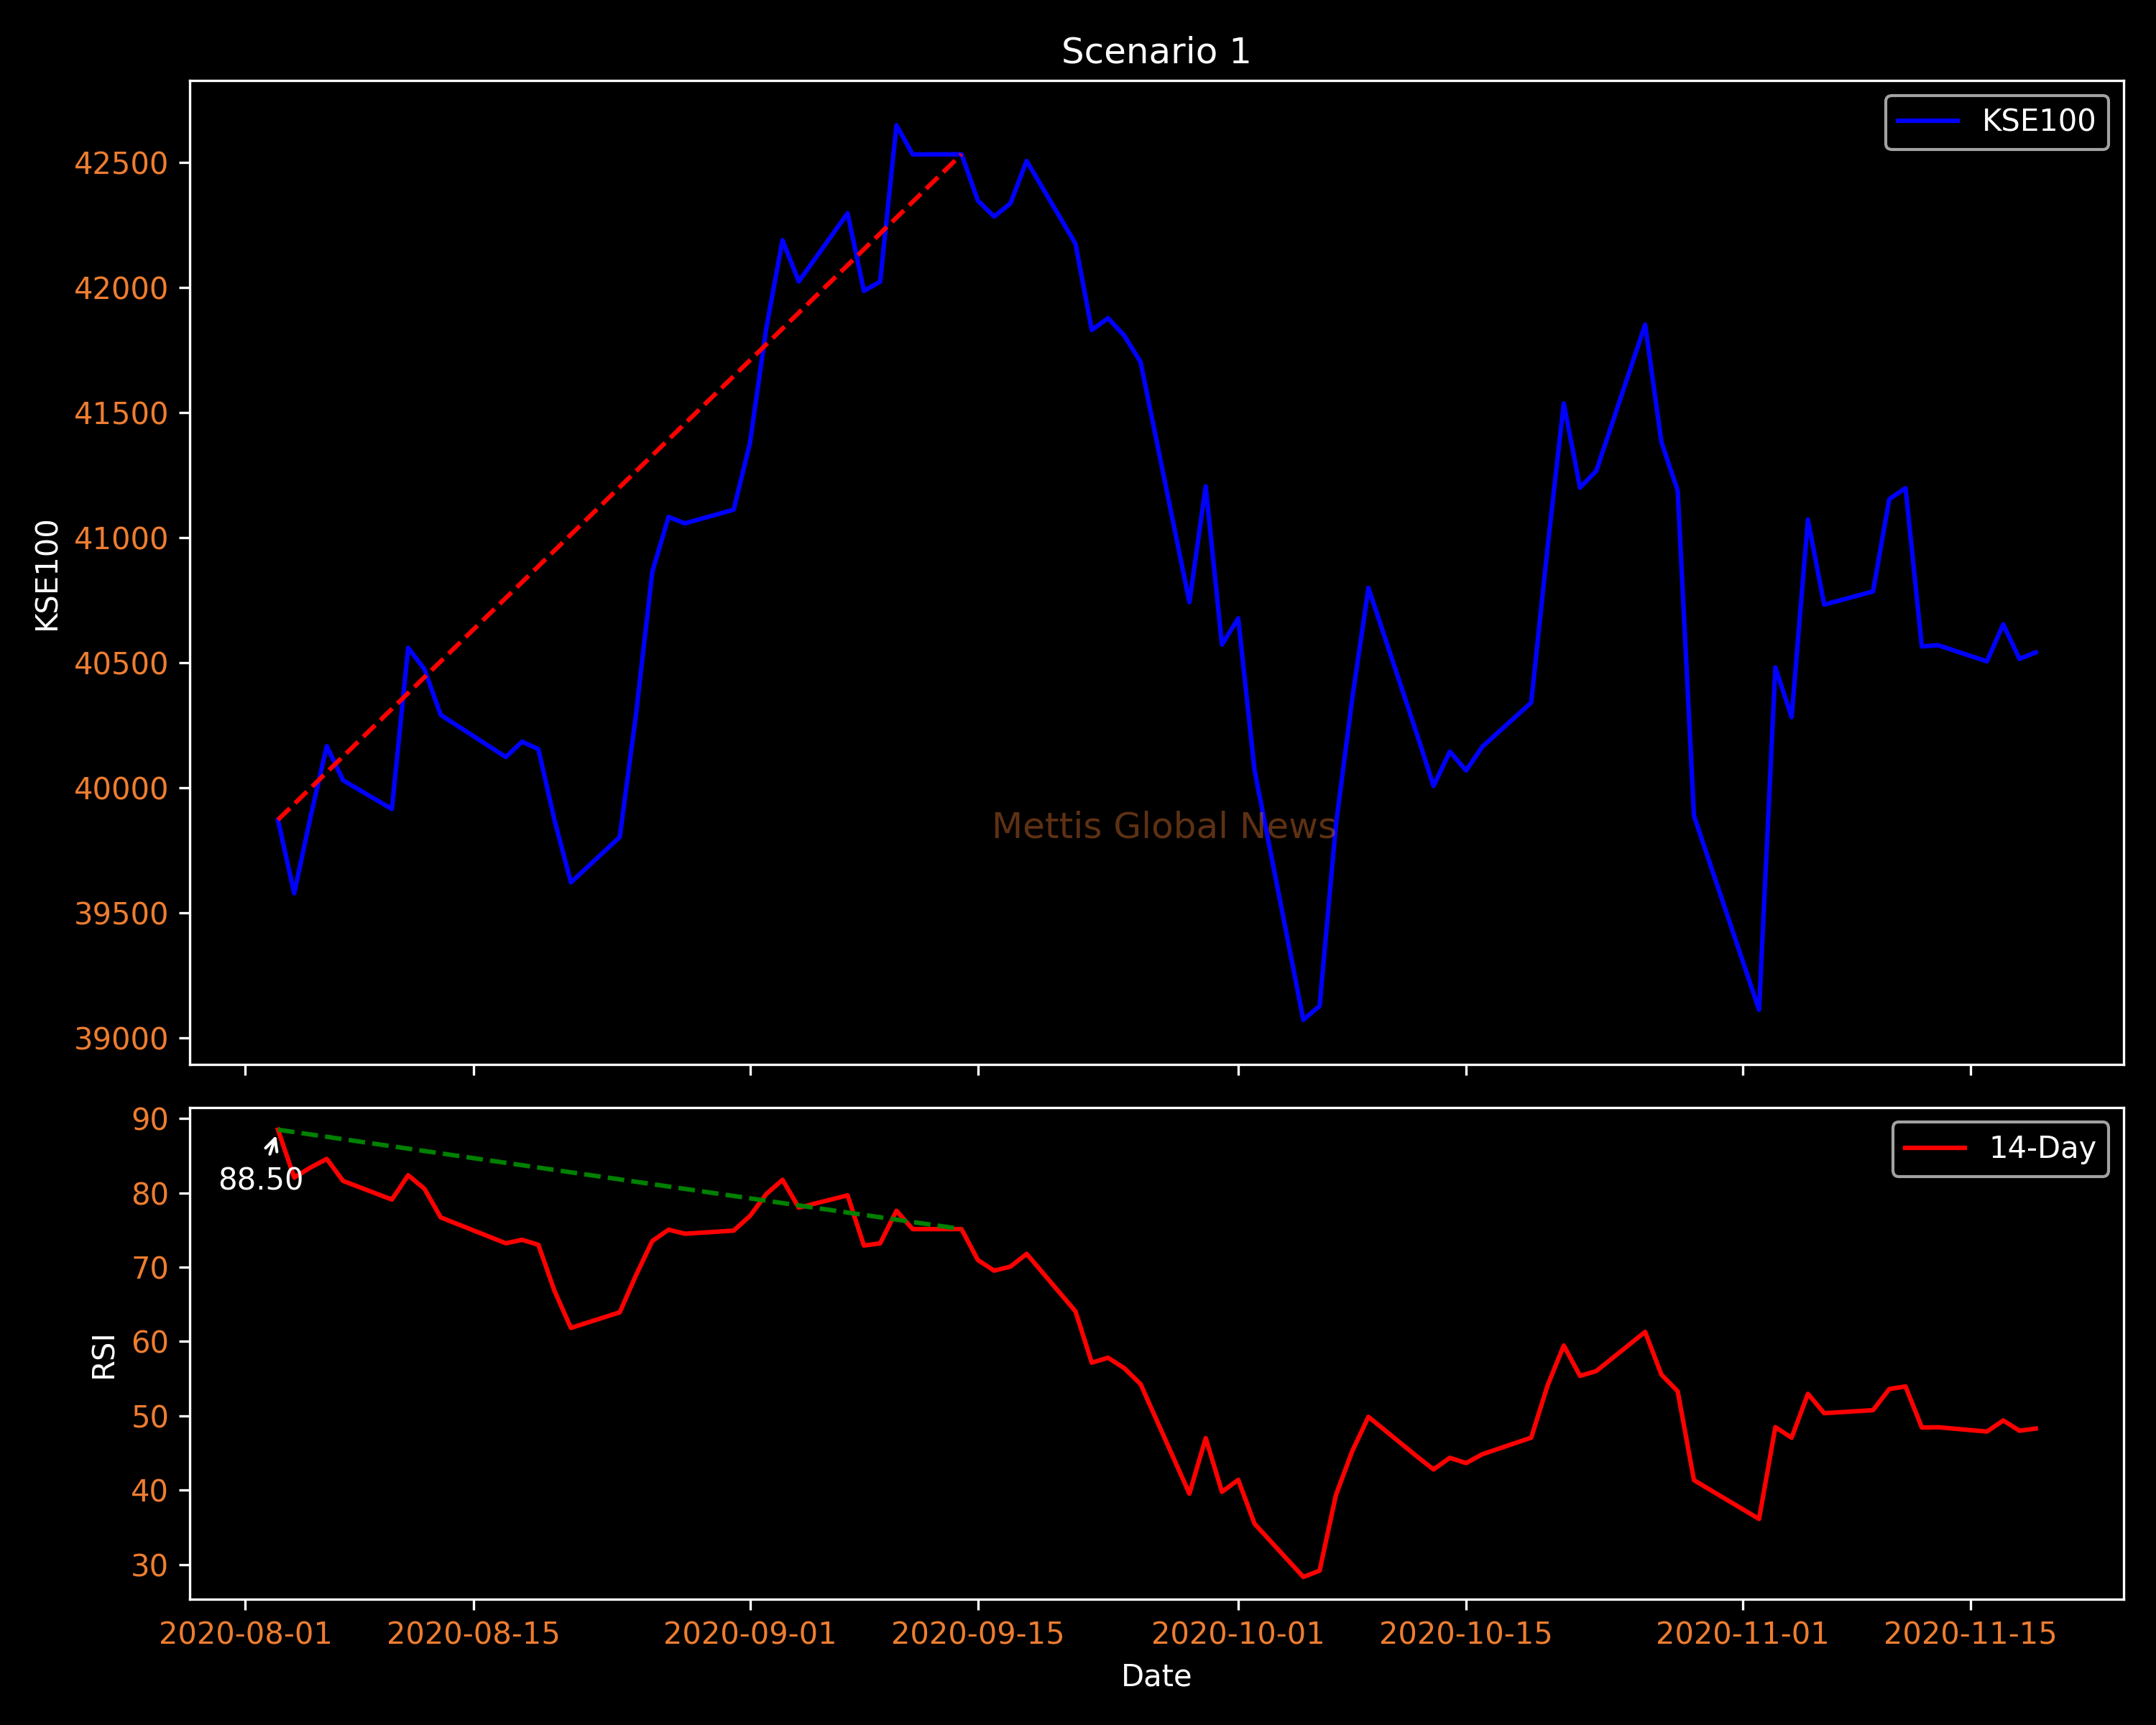
In August 2020, KSE-100's RSI was at 88.5, while the index was around 39,800 at that time.
Over the next few days, the RSI cooled off towards the mid-70s, while the KSE-100 continued its upward momentum towards 42,500.
Another example can be seen in November 2019, when the RSI was at 87.3 and the KSE-100 was at 38,400.
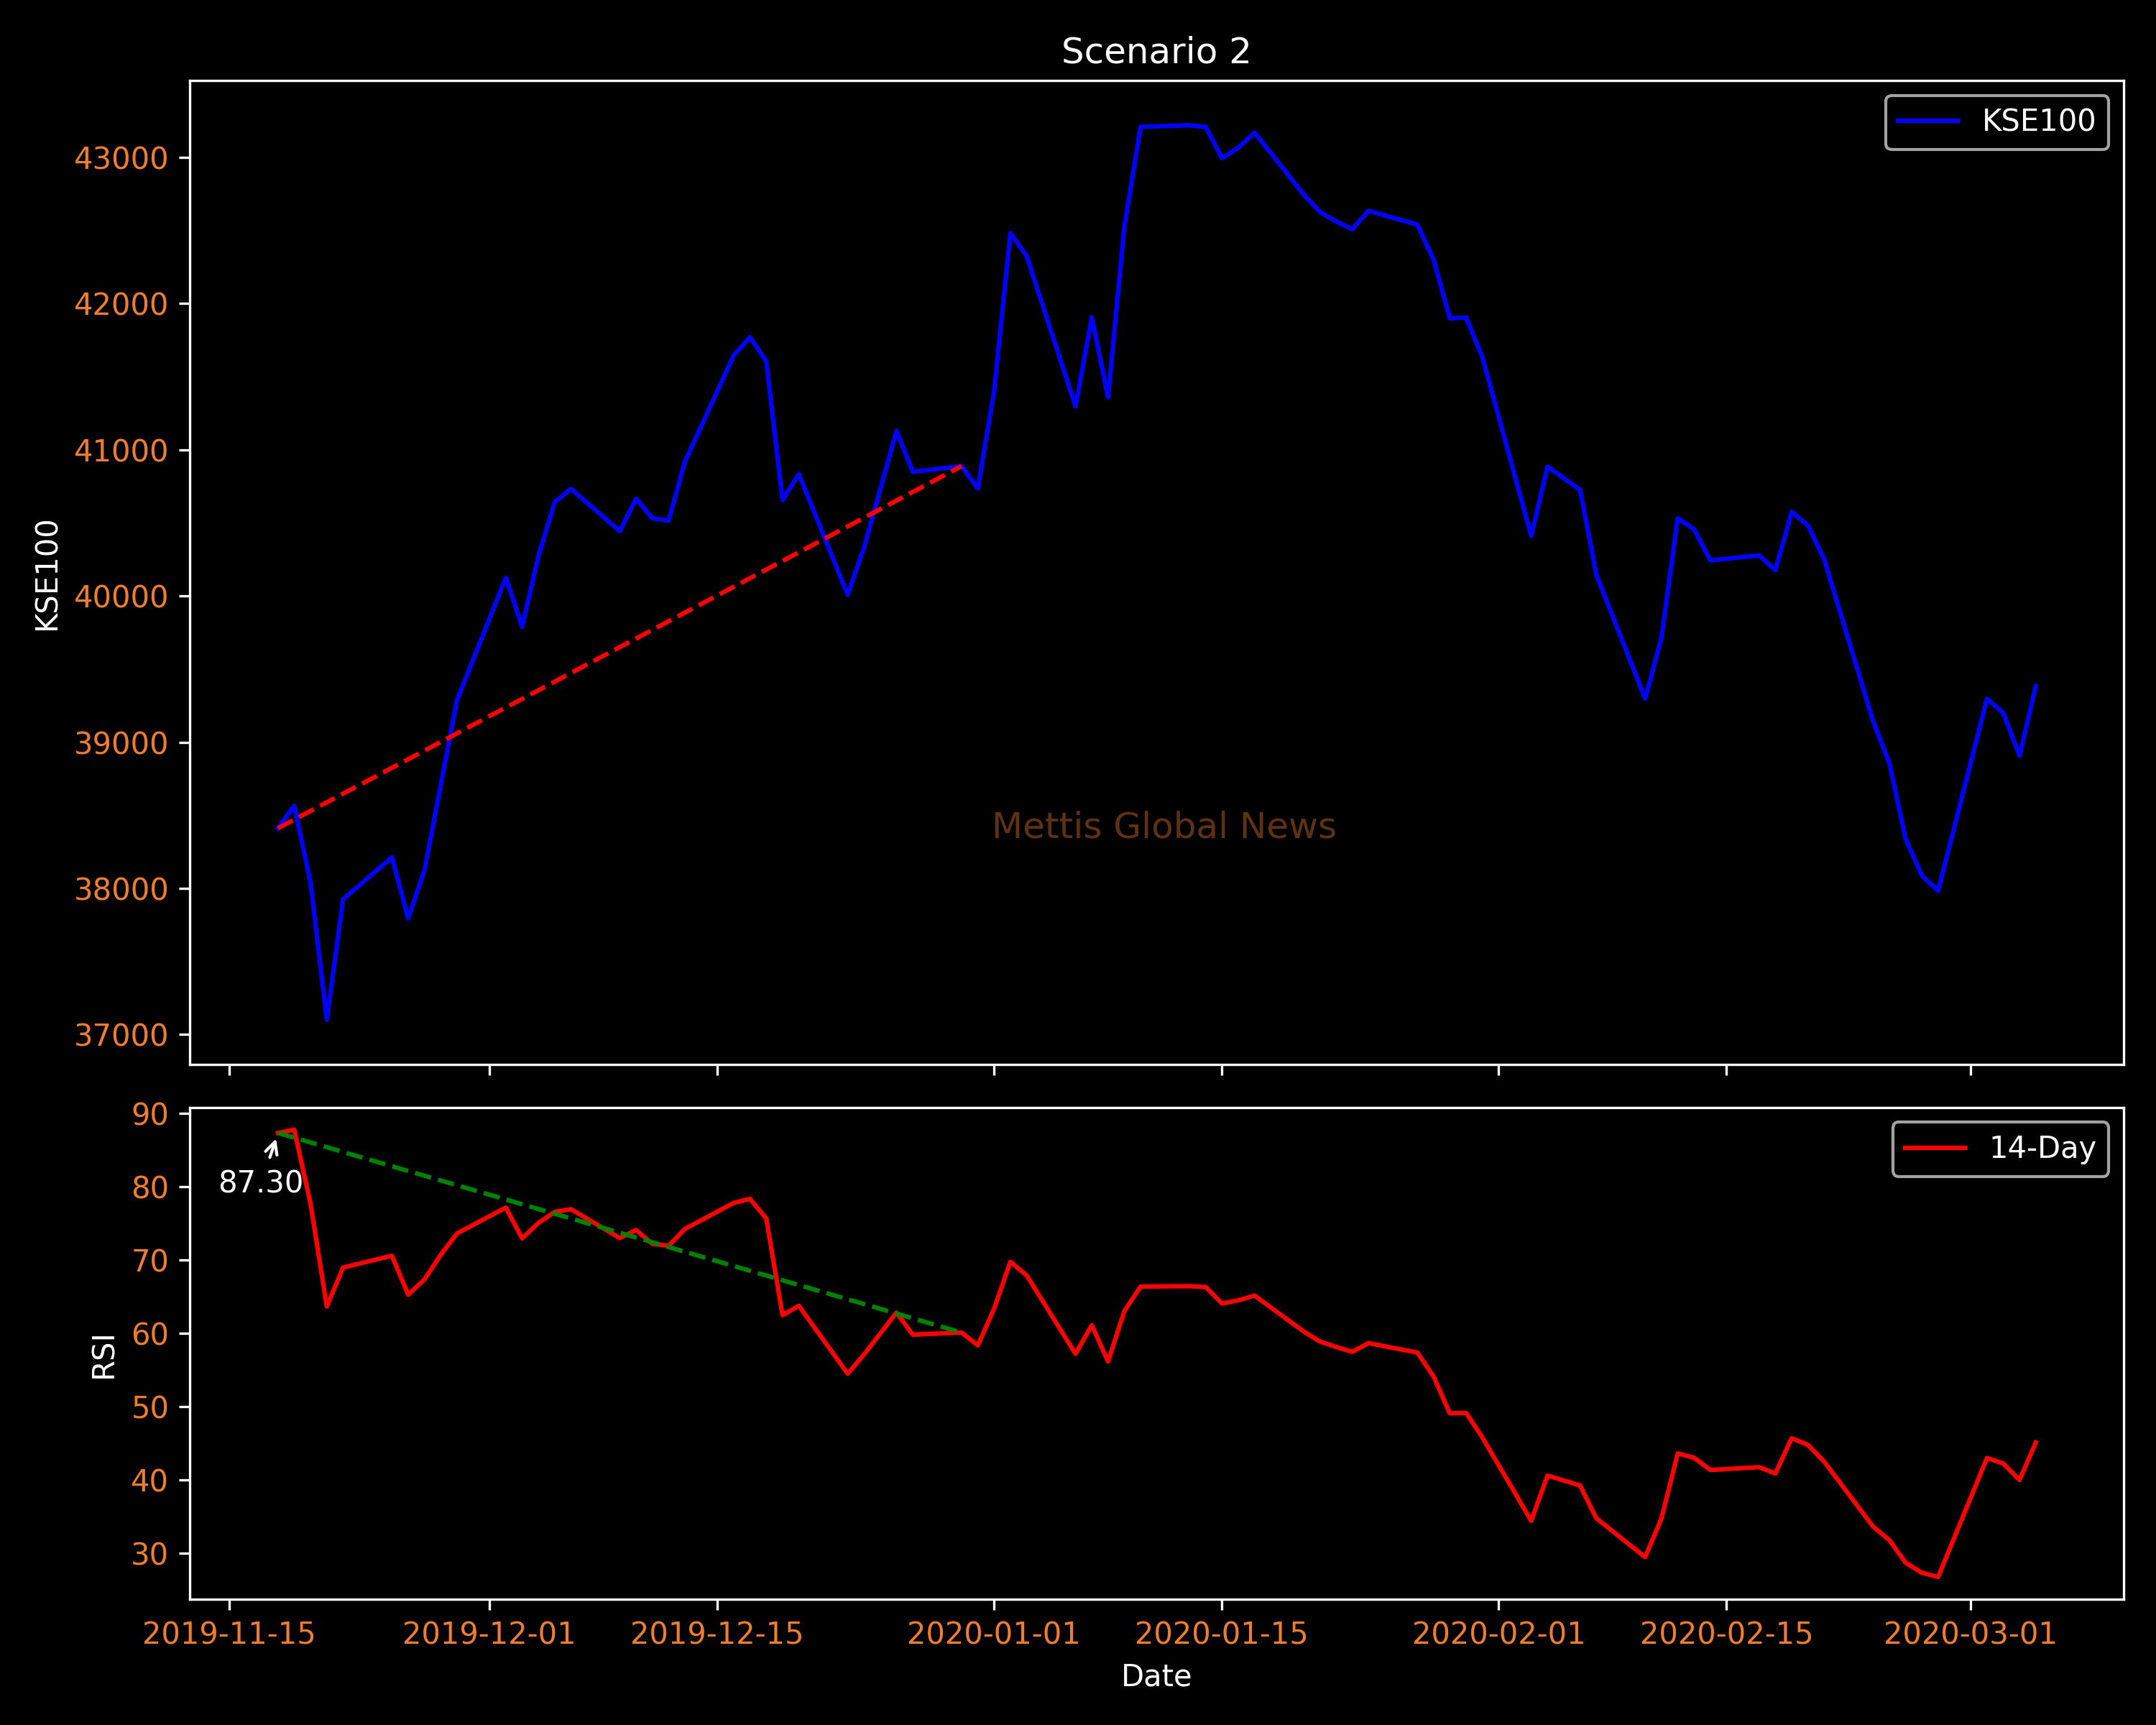
Over the next few days, the RSI continuously cooled off towards the 60s, but the KSE-100 index did not stop its upward momentum until it hit 43,000, which is a gain of more than 10%.
In both the scenarios, when corrections did occur, the index tended to return to levels close to where it started when the RSI hit 87-88.
To put this into context, it means that if someone exited or sold the market when the RSI reached 'overbought' territory, even after the correction, the KSE-100 would not be significantly below the initial level, while the RSI would have cooled down to as low as 30s.
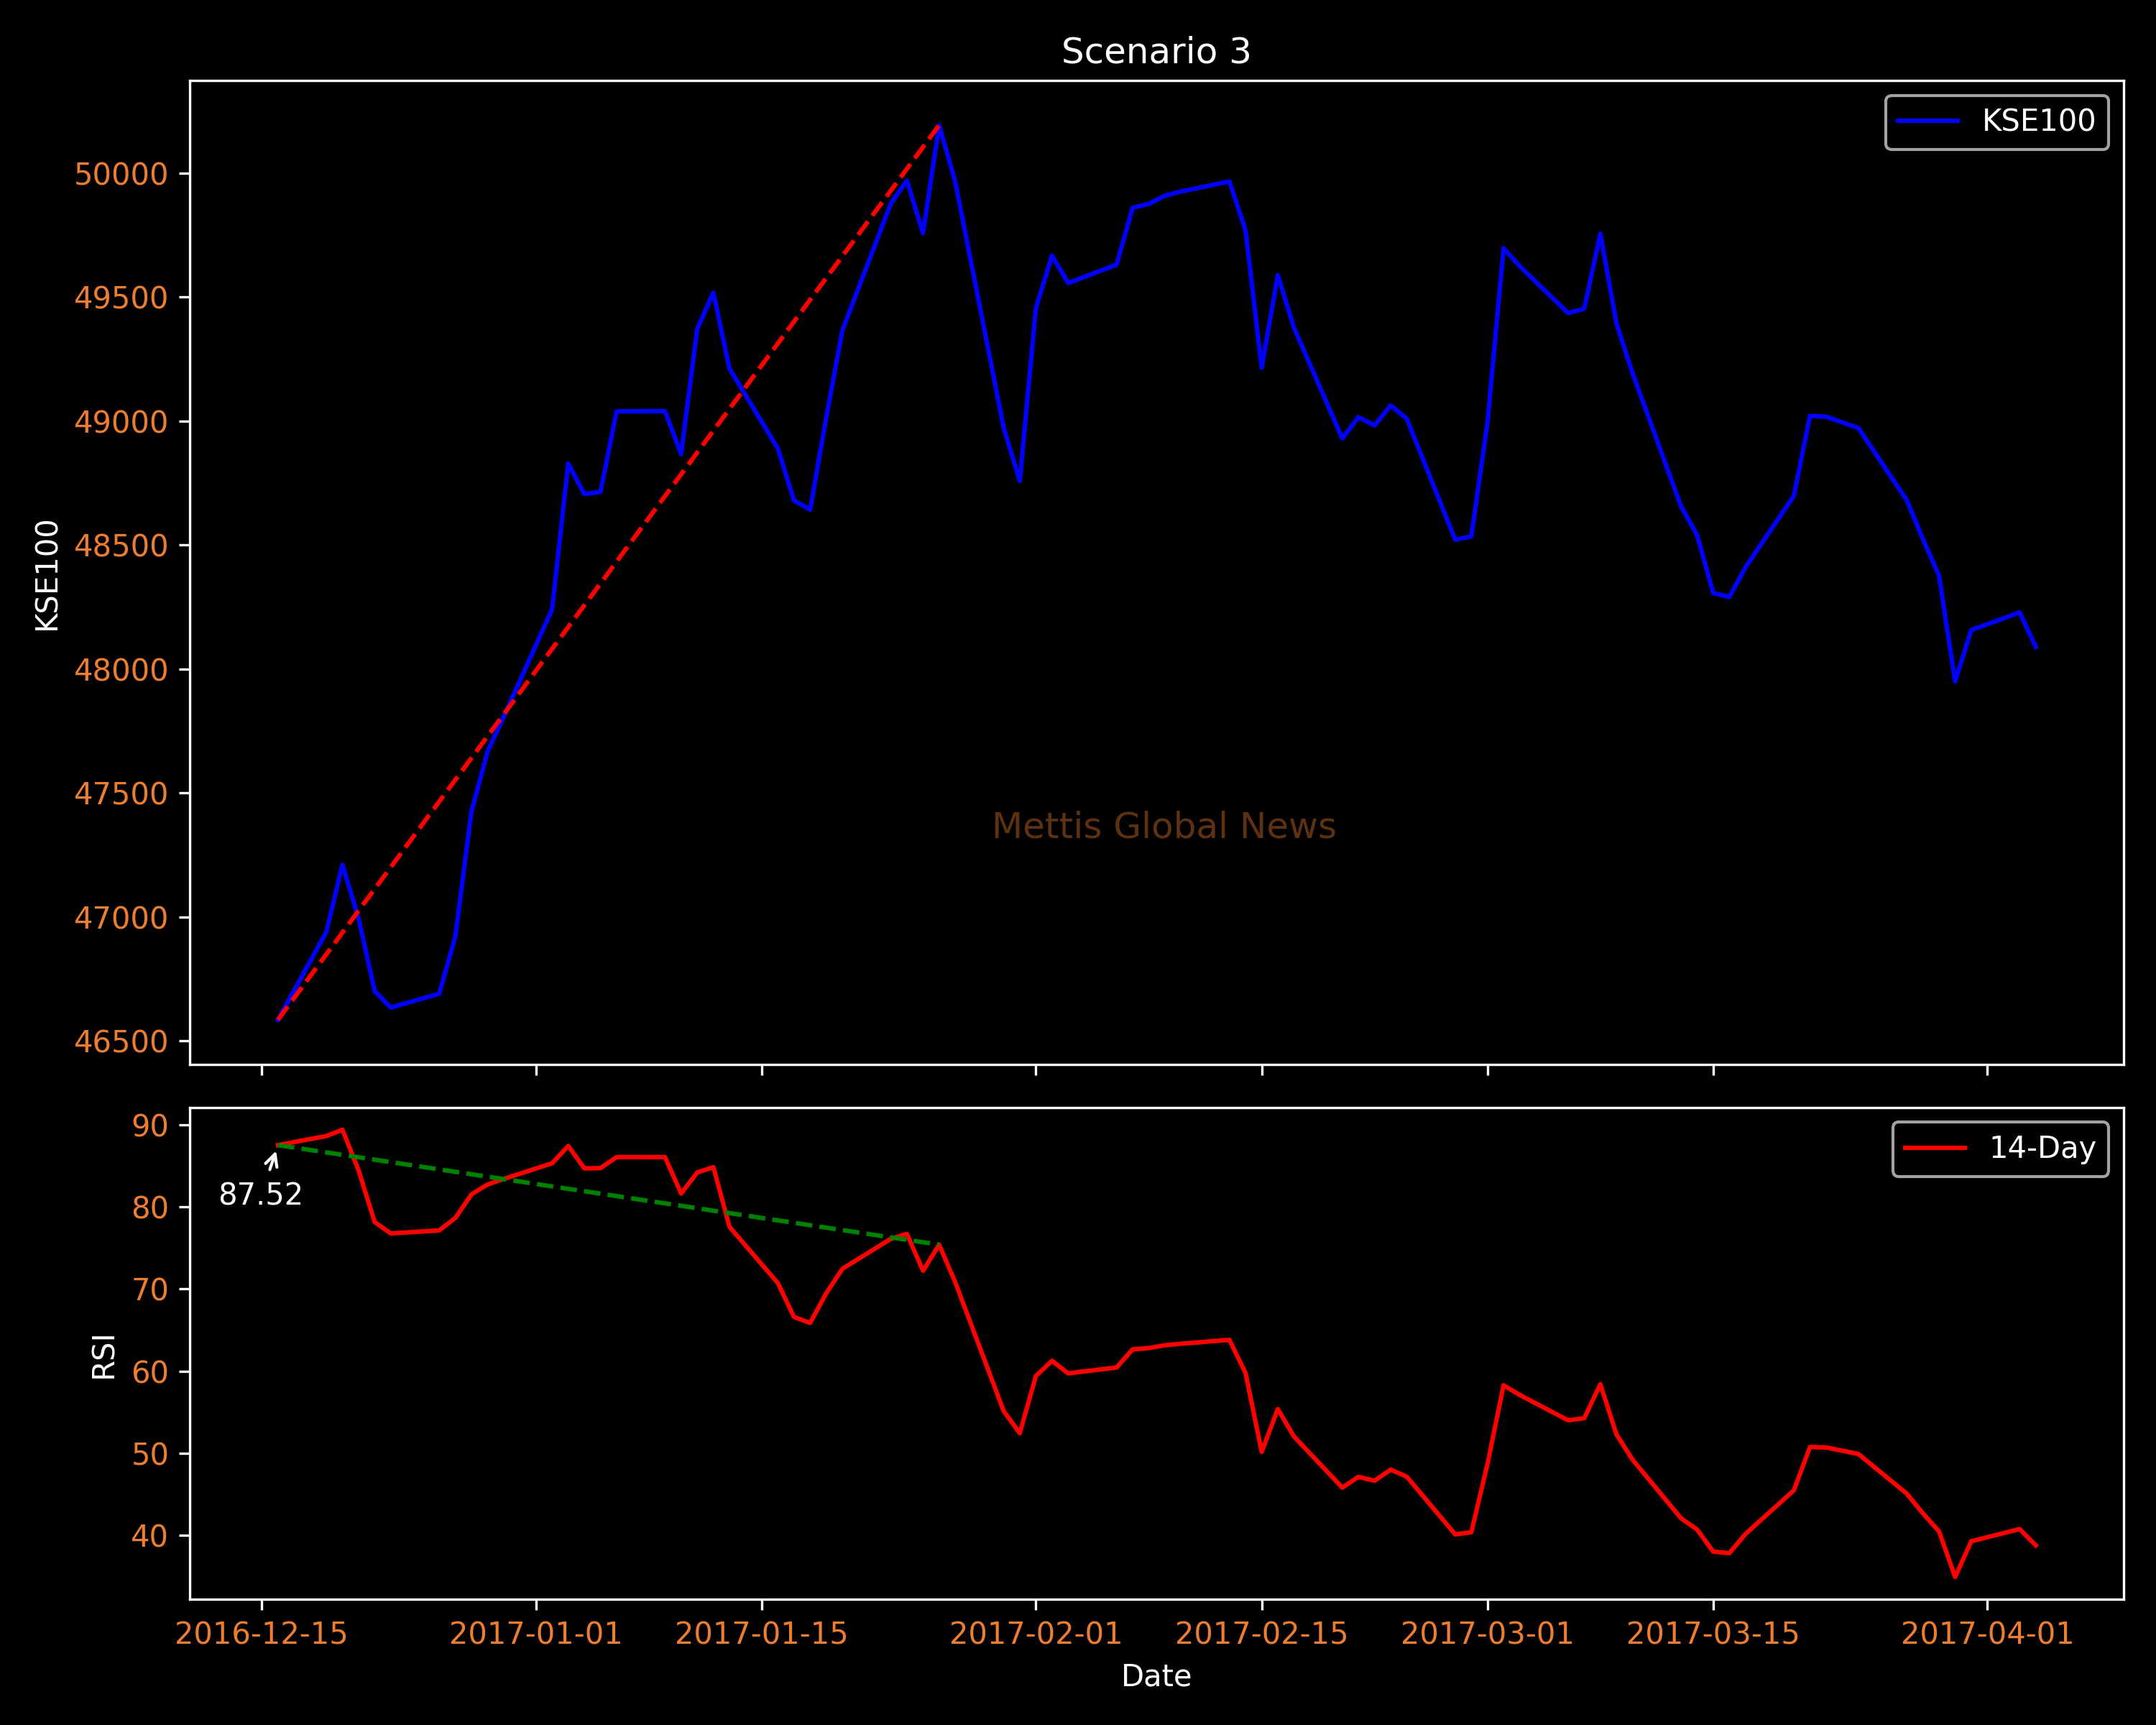
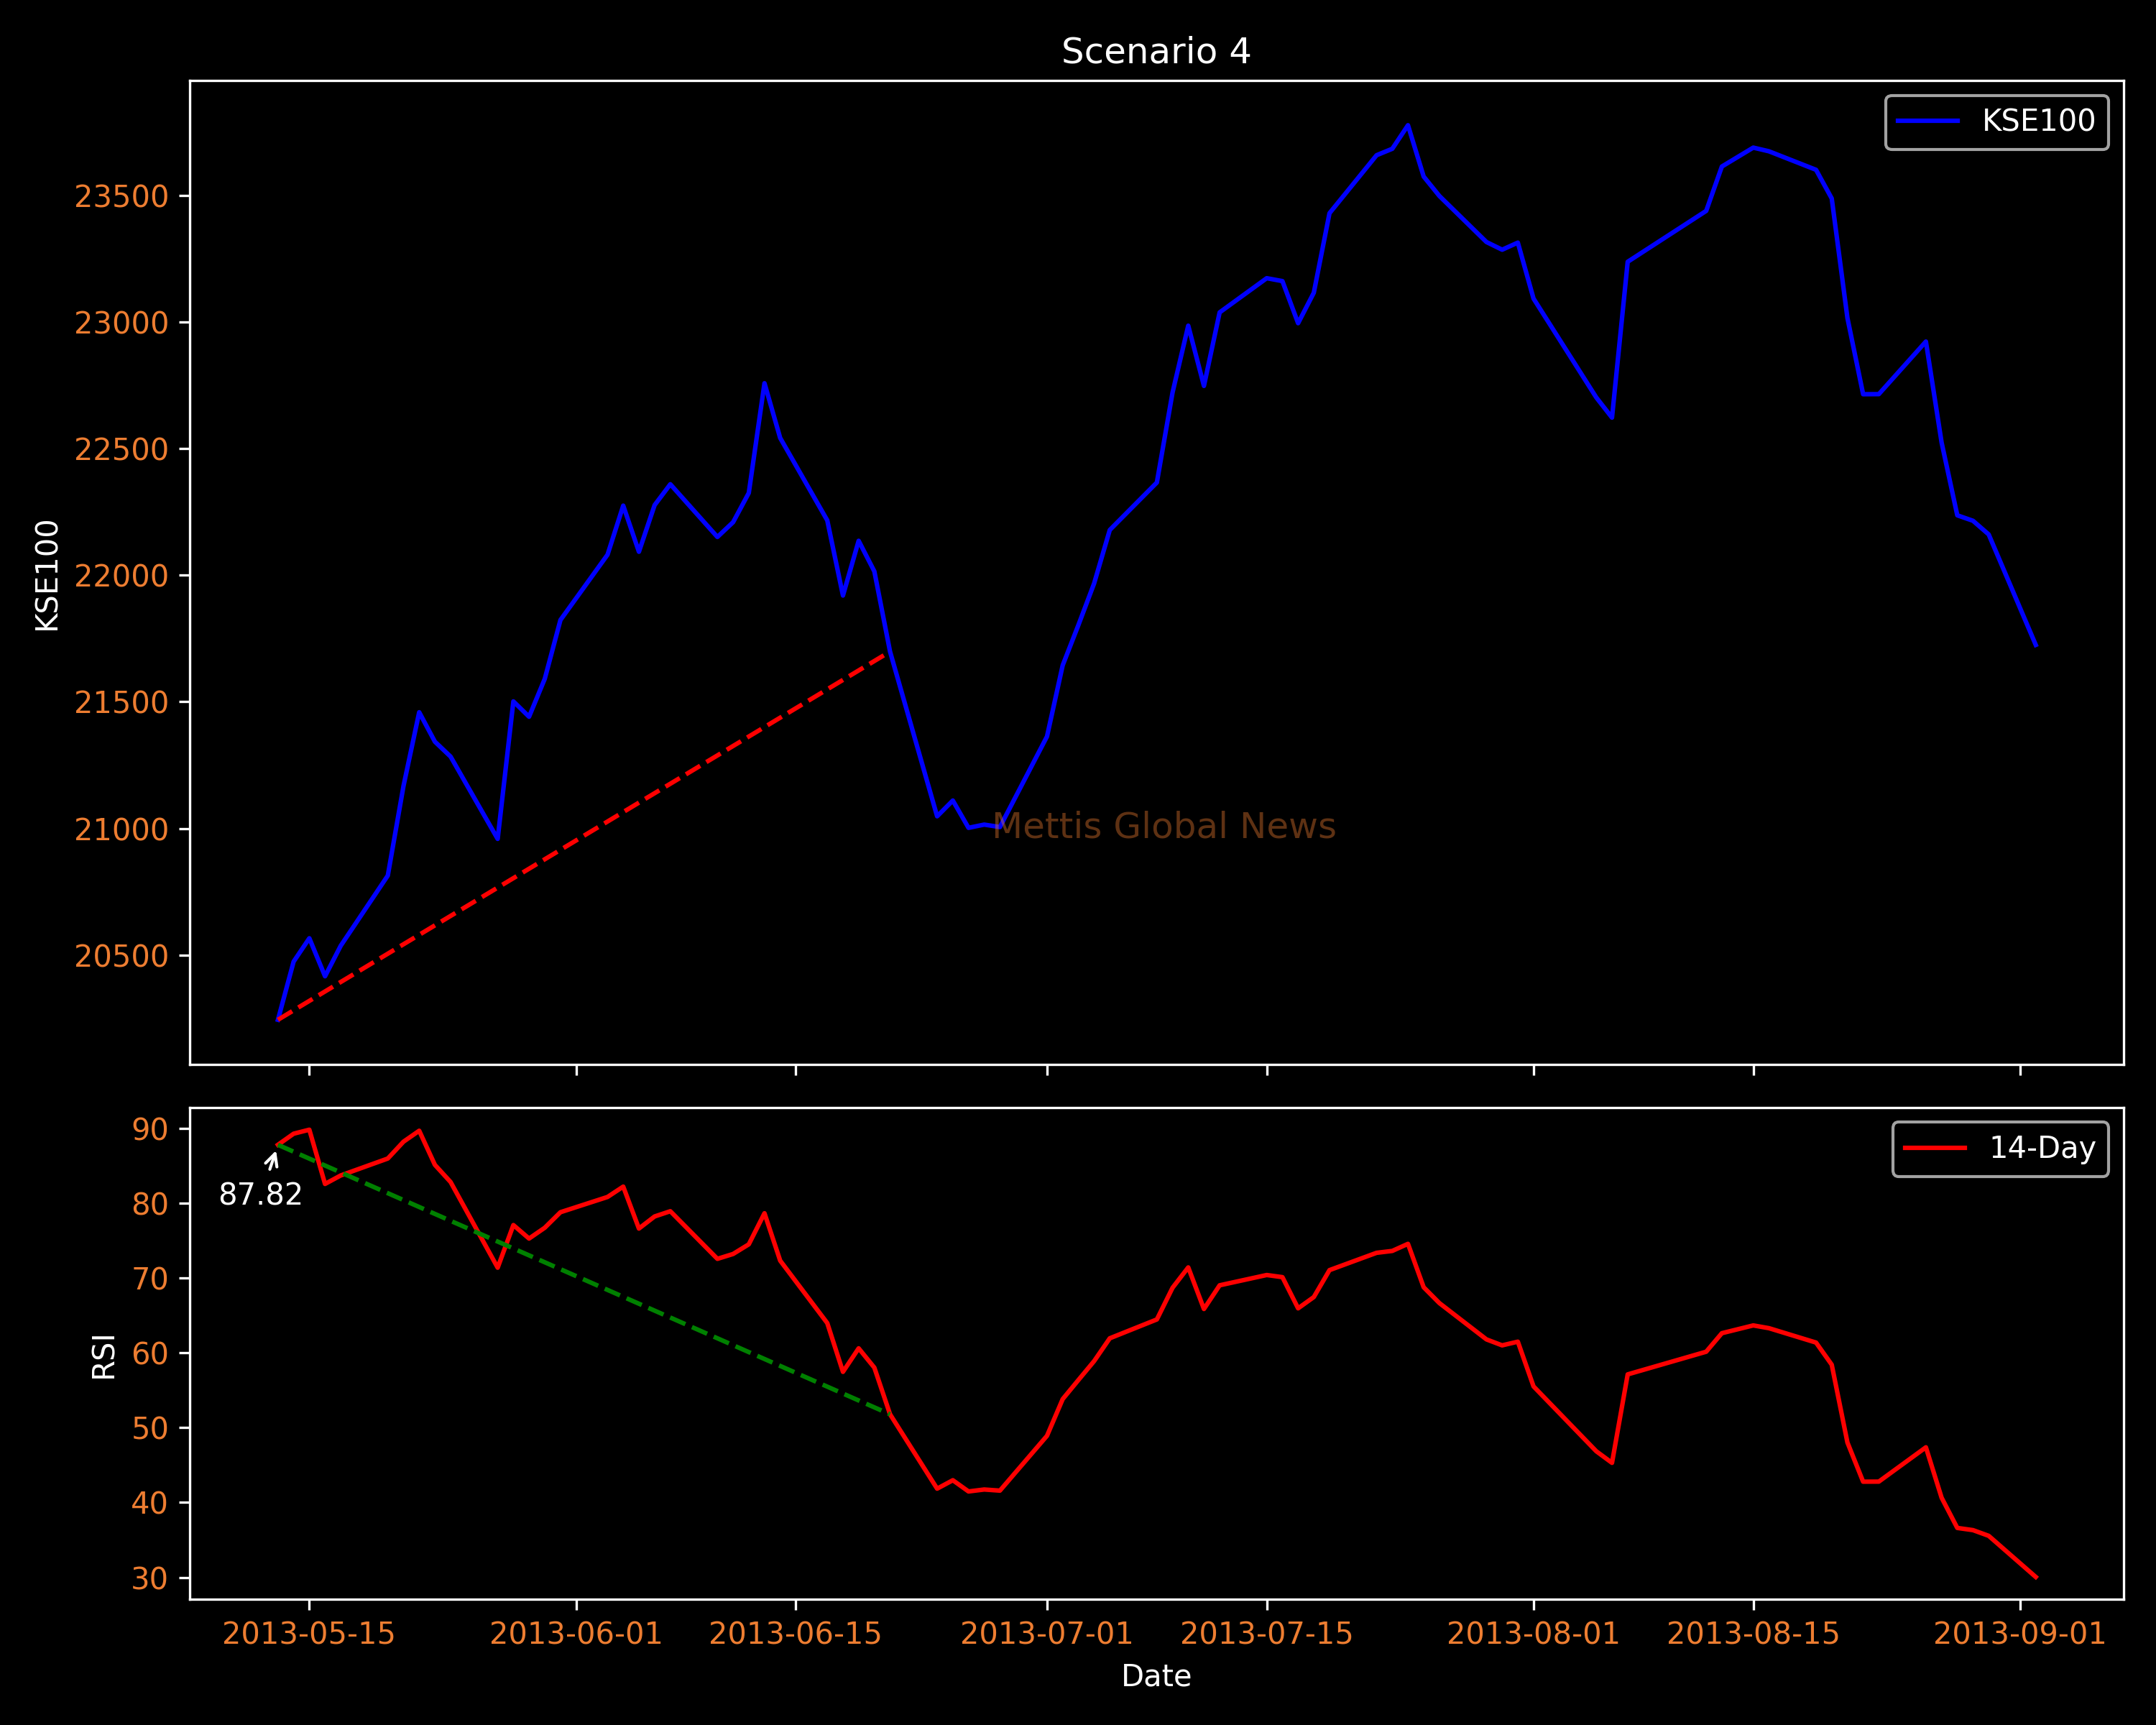
The following charts show two more scenarios that illustrate the same picture.
So, RSI on its own does not necessarily mean anything. It is just one indicator among many that can help investors gauge the market.
While an "overbought" signal might raise concerns, history suggests that the market has shown resilience and the ability to weather such conditions.
Furthermore, the historical data of various assets show that the RSI can stay in overbought or oversold territories for extended periods before any substantial corrections occur.
Disclaimer: The views and analysis in this article are the opinions of the author and are for informational purposes only. It is not intended to be financial or investment advice and should not be the basis for making financial decisions.
Copyright Mettis Link News
Related News


| Name | Price/Vol | %Chg/NChg |
|---|---|---|
| KSE100 | 173,962.82 313.69M | 1.30% 2237.52 |
| ALLSHR | 104,178.62 550.40M | 0.93% 964.13 |
| KSE30 | 52,166.33 164.58M | 1.26% 649.19 |
| KMI30 | 250,496.48 141.11M | 1.59% 3930.77 |
| KMIALLSHR | 67,844.06 318.73M | 1.20% 801.29 |
| BKTi | 47,430.11 44.68M | 0.28% 130.40 |
| OGTi | 36,386.96 9.01M | 0.13% 45.59 |
| Symbol | Bid/Ask | High/Low |
|---|
| Name | Last | High/Low | Chg/%Chg |
|---|---|---|---|
| BITCOIN FUTURES | 73,715.00 | 73,760.00 73,715.00 | 0.00 0.00% |
| BRENT CRUDE | 91.89 | 92.95 89.93 | -0.81 -0.87% |
| RICHARDS BAY COAL MONTHLY | 117.00 | 0.00 0.00 | -0.75 -0.64% |
| ROTTERDAM COAL MONTHLY | 130.25 | 131.75 130.00 | -0.20 -0.15% |
| USD RBD PALM OLEIN | 1,157.50 | 1,157.50 1,157.50 | 0.00 0.00% |
| CRUDE OIL - WTI | 87.76 | 89.02 86.35 | -1.14 -1.28% |
| SUGAR #11 WORLD | 14.07 | 14.35 13.90 | 0.14 1.01% |
Chart of the Day
Latest News
Top 5 things to watch in this week
Pakistan Stock Movers
| Name | Last | Chg/%Chg |
|---|
| Name | Last | Chg/%Chg |
|---|