
Weekly Market Roundup
_20260718084208095_39c9d2.jpeg?width=950&height=450&format=Webp)
MG News | July 18, 2026 at 02:34 PM GMT+05:00

July 18, 2026 (MLN): The benchmark KSE-100 Index
closed the week ended July 17, 2026 at 175,802.79 points, losing 6,438.99
points, or 3.53%, on a week-on-week basis from 182,241.78
points recorded on July 10, 2026.
Investor sentiment weakened during the week as investors
booked profits following the recent market rally, while weaker-than-expected
external account data added to the cautious mood.
Market confidence was further dented after Pakistan posted a
$649m current account deficit in June 2026, compared with a $500m
surplus in May 2026 and a $220m surplus in June 2025, raising
concerns over the country's external sector and triggering broad-based selling
across key sectors.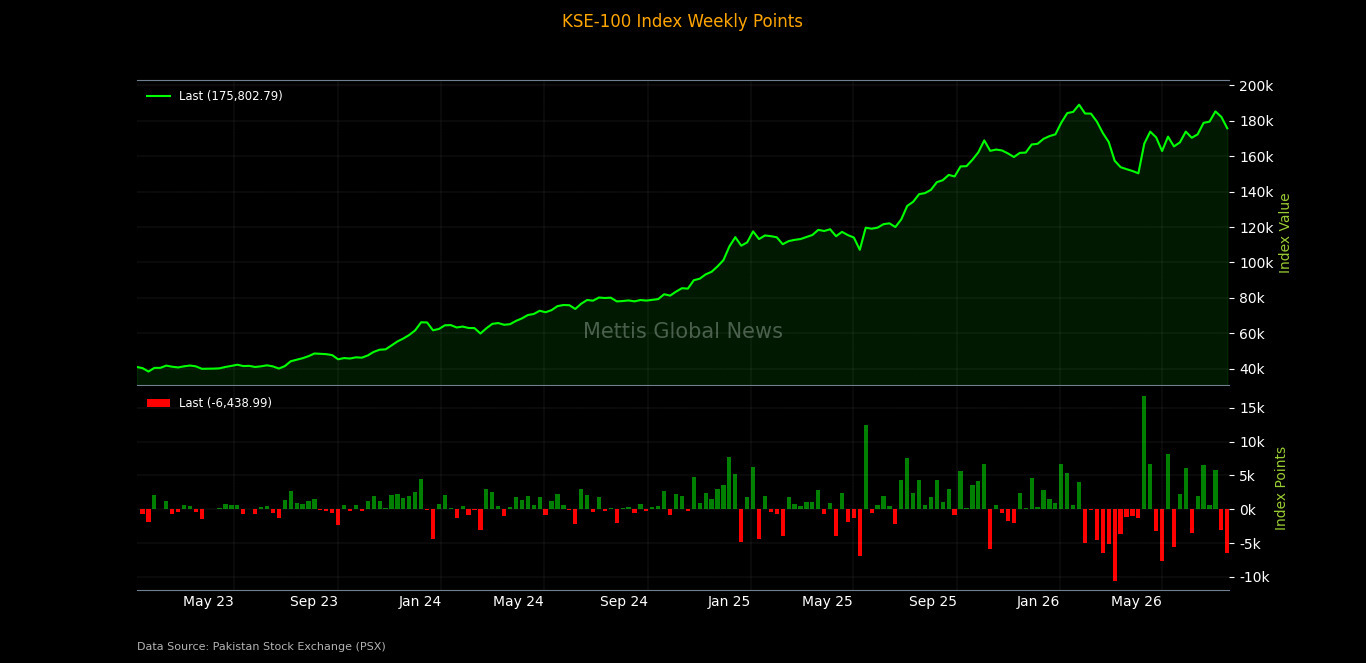
Market Capitalization
The Pakistan Stock Exchange's market capitalization declined
by Rs208.81bn during the week, falling from Rs5.212tr on July
10 to Rs5.003tr on July 17.
In dollar terms, market capitalization decreased from $18.74bn
to $18.00bn, registering a decline of approximately $744.98m over
the week.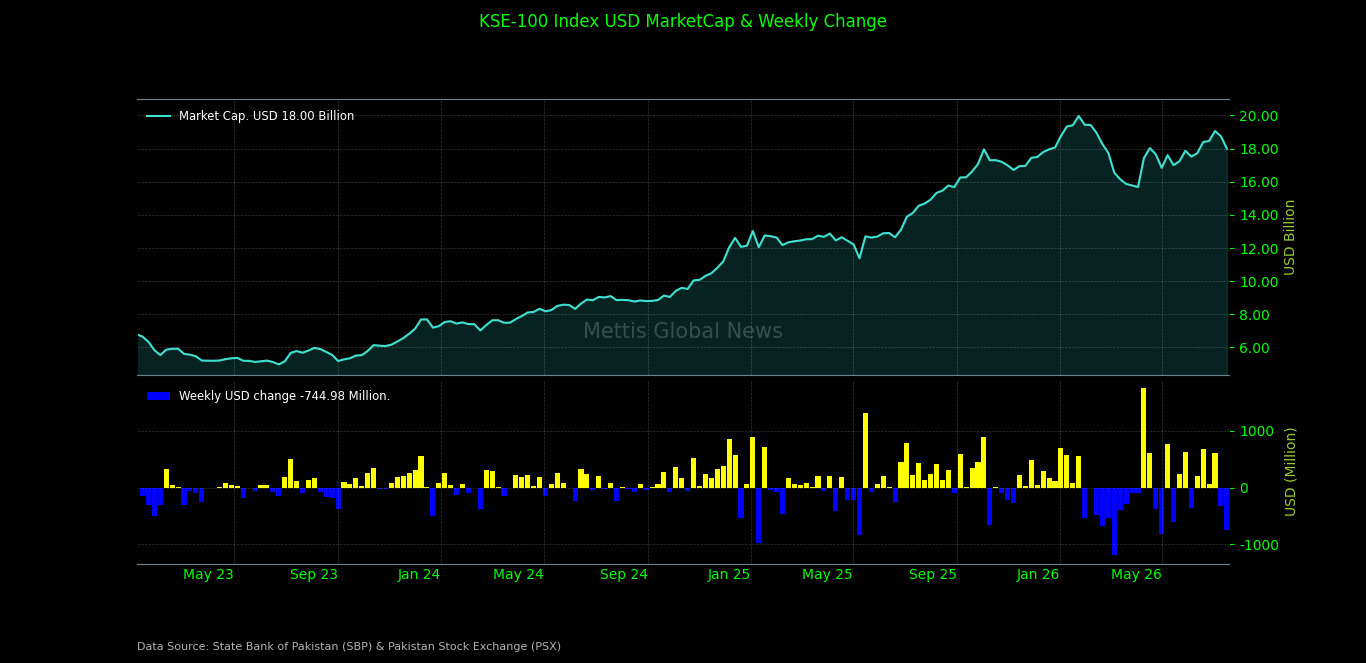
The market's USD-adjusted return stood at -3.50%,
compared with -1.67% in the previous week, reflecting the benchmark's
decline after accounting for currency movements._20260718084151910_9907aa.jpeg)
On the macroeconomic front, Pakistan's
foreign direct investment (FDI) fell 34% to $1.64bn in FY26, while
June inflows plunged to $13.5m from $210m a year earlier, according to
SBP data.
Meanwhile, total foreign investment turned into a $450.6m
divestment in FY26, compared with $1.75bn in net investment during
the same period last year.
Pakistan's
REER rose to 106.44 in June 2026, indicating a slight gain in the
rupee's inflation-adjusted value but a further decline in export
competitiveness.
Pakistan's current account swung to a $139m
deficit in FY26 from a $1.84bn surplus in FY25, as a wider trade
gap outweighed modest growth in exports and remittances.
Pakistan's
LSMI output fell 0.98% YoY in May 2026 despite a 1.21%
monthly increase, while cumulative industrial production grew 5.77%
during Jul–May FY26, driven by automobiles, sugar and petroleum products.
Pakistan's car sales
jumped 39.4% in FY26 to 206,436 units, while June sales
climbed 28.8% month-on-month, reflecting continued strength in auto demand.
Index Movers
Sector-wise performance remained overwhelmingly negative
during the week, with Commercial Banks exerting the largest drag on the
KSE-100 Index by 1,946.24 points, followed by Oil & Gas
Exploration Companies (990.31 points), Cement (836.78 points), Fertilizer
(447.13 points), Power Generation & Distribution (385.38 points),
Technology & Communication (347.50 points), Investment
Banks/Investment Companies/Securities Companies (208.13 points), Pharmaceuticals
(195.40 points), Automobile Assembler (186.59 points), Textile
Composite (152.29 points), Oil & Gas Marketing Companies (131.35
points), Food & Personal Care Products (73.43 points),
Property (71.26 points), Leather & Tanneries
(61.52 points), Engineering (61.20 points), Cable &
Electrical Goods (56.88 points), Chemical (46.83 points), Glass
& Ceramics (46.52 points), Transport (41.36 points), Miscellaneous
(38.28 points), Insurance (27.52 points), Synthetic & Rayon
(23.23 points), Automobile Parts & Accessories (16.92 points),
Tobacco (12.27 points), Refinery (7.30 points),
Textile Spinning (6.76 points), Close-End Mutual Fund (6.20 points),
Real Estate Investment Trust (5.54 points), Sugar & Allied
Industries (2.33 points),
Modarabas (1.97 points), Paper, Board &
Packaging (1.66 points), Textile Weaving (1.55 points), Vanaspati
& Allied Industries (0.83 points), Woollen (0.32 points) and Leasing
Companies (0.21 points).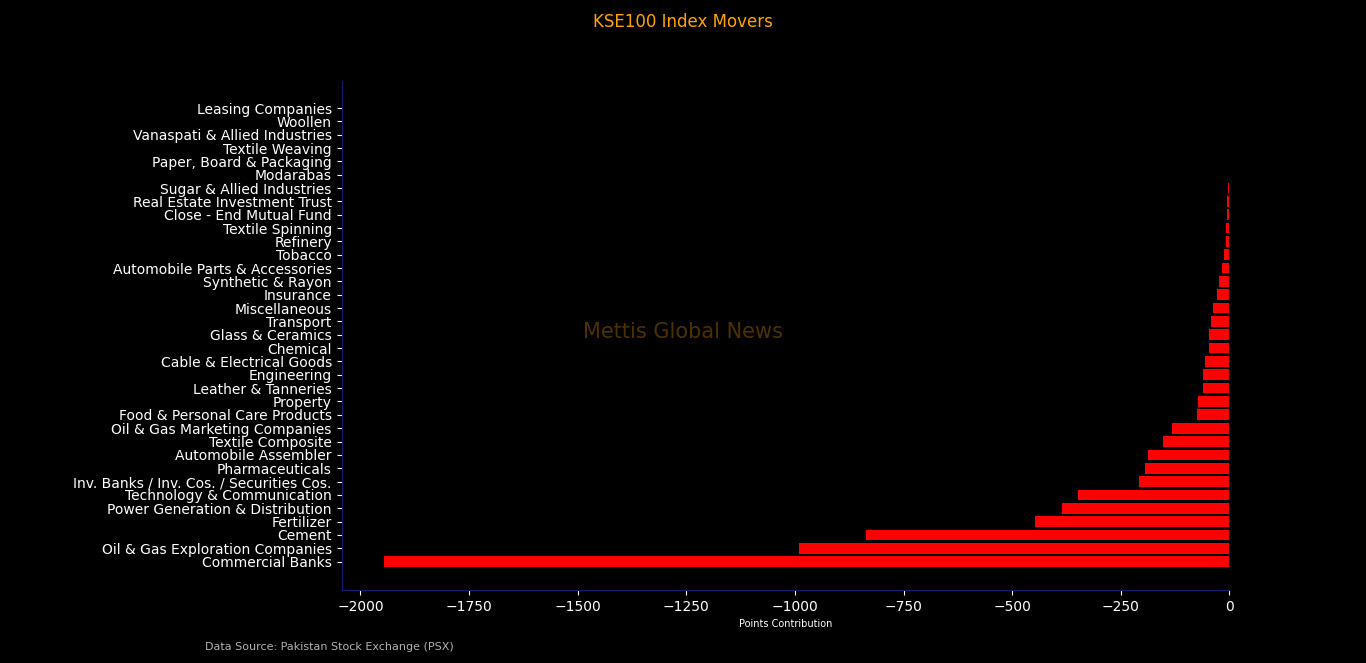
Among individual stocks, UBL emerged as the largest
contributor to the index, adding 554.77 points, followed by PPL
(394.10 points), OGDC (365.83 points), LUCK (353.12 points), HUBC
(304.70 points), FFC (275.00 points), MEBL (264.32 points), MCB
(227.47 points), MARI (215.39 points) and SYS (208.84 points).
Other notable positive contributors included HBL (193.15
points), ENGROH (156.70 points), BAHL (146.25 points), MLCF
(144.29 points), DGKC (127.50 points), BOP (117.07 points), NBP
(111.34 points), BAFL (94.04 points), AKBL (93.28 points) and
EFERT (92.21 points).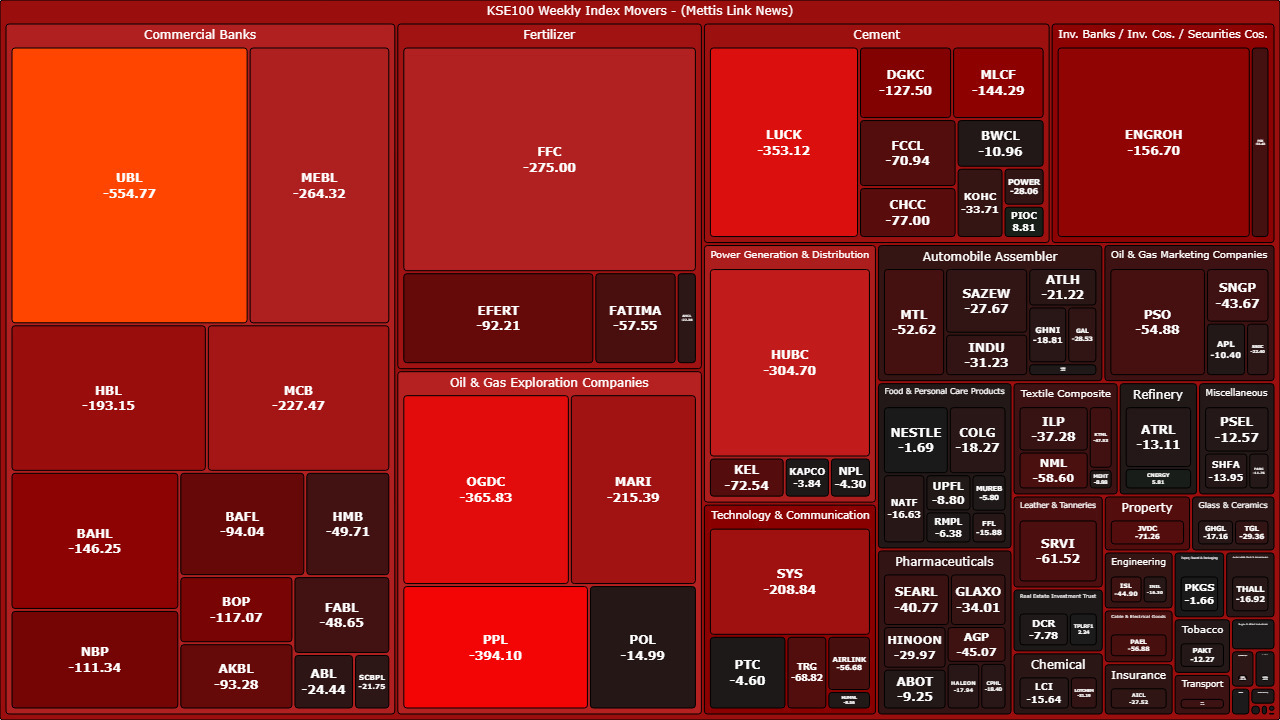
FIPI/LIPI
Foreign investors remained net buyers during the
week, recording net equity purchases of Rs5.42bn ($19.52m).
The buying was primarily driven by Foreign Corporates,
which accumulated equities worth Rs4.30bn ($15.47m). Overseas
Pakistanis also remained net buyers with Rs1.12bn ($4.03m) worth of
equity purchases.
On the local side, Individuals emerged as the largest
buyers, with net equity purchases of Rs3.80bn ($13.66m).
Companies also remained net buyers with Rs1.11bn
($3.98m), followed by Insurance Companies with Rs840.82m ($3.02m),
Banks/DFIs with Rs564.66m ($2.03m) and NBFCs with Rs101.02m
($363,380).
The largest sellers were Mutual Funds, which
offloaded equities worth Rs10.44bn ($37.56m).
Broker Proprietary Trading recorded net selling of Rs1.00bn
($3.60m), followed by Other Organizations with Rs389.36m ($1.40m)._20260718084146943_663885.jpeg)
Copyright Mettis Link News
Related News

_20261009161631180_9d2ce0.jpeg?width=280&height=140&format=Webp)
_20260518072716198_9300ef.jpeg?width=280&height=140&format=Webp)
| Name | Price/Vol | %Chg/NChg |
|---|---|---|
| KSE100 | 167,089.28 109.91M | -0.21% -352.63 |
| ALLSHR | 101,117.40 308.32M | -0.15% -155.10 |
| KSE30 | 49,841.71 50.59M | -0.28% -142.15 |
| KMI30 | 240,372.43 78.75M | -0.02% -45.72 |
| KMIALLSHR | 65,518.16 188.07M | -0.05% -35.70 |
| BKTi | 46,228.77 7.60M | -0.60% -281.04 |
| OGTi | 33,974.66 4.20M | -0.27% -91.31 |
| Symbol | Bid/Ask | High/Low |
|---|
| Name | Last | High/Low | Chg/%Chg |
|---|---|---|---|
| BITCOIN FUTURES | 83,505.00 | 84,320.00 82,645.00 | 1035.00 1.26% |
| BRENT CRUDE | 104.54 | 0.00 0.00 | -0.18 -0.17% |
| RICHARDS BAY COAL MONTHLY | 128.50 | 0.00 0.00 | 0.75 0.59% |
| ROTTERDAM COAL MONTHLY | 143.40 | 143.40 143.40 | -1.15 -0.80% |
| USD RBD PALM OLEIN | 1,167.50 | 1,167.50 1,167.50 | 0.00 0.00% |
| CRUDE OIL - WTI | 91.66 | 0.00 0.00 | -0.19 -0.21% |
| SUGAR #11 WORLD | 20.27 | 20.44 20.09 | 0.12 0.60% |
Chart of the Day
Latest News
Top 5 things to watch in this week
 PIB Auction
Pakistan Stock Movers
| Name | Last | Chg/%Chg |
|---|
| Name | Last | Chg/%Chg |
|---|