Weekly Market Roundup

MG News | June 13, 2026 at 02:15 PM GMT+05:00

June 13, 2026 (MLN): Pakistan’s equity market recovered during the week ended June 12, 2026, as the benchmark KSE-100 Index closed at 172,399.90, up from 170,478.94 a week earlier, gaining 1,920.96 points or 1.13% WoW.
The positive momentum was driven by broad-based buying as
investor confidence improved, supported by expectations of progress in US–Iran
relations, easing global oil prices, and pre-budget positioning as investors
sought clarity on upcoming policy direction, leading to selective interest
across key sectors._20260613091223739_ef4575.jpeg)
Market Capitalization
Total market capitalization increased in line with the index
performance. As of June 12, 2026, market cap stood at Rs4.932 trillion,
compared to Rs4.877tr on June 5, 2026, reflecting an increase of Rs54.95bn
or 1.13% WoW.
In USD terms, market capitalization rose to $17.72bn from
$17.52bn, marked an increase of $203.03m WoW, supported by improved
equity valuations and stable currency conditions._20260613091206835_4cc919.jpeg)
Dollar-adjusted returns turned positive at 1.159% WoW,
sharply improving from -1.971% in the previous week, indicating a
recovery in investor sentiment in both local and foreign currency terms.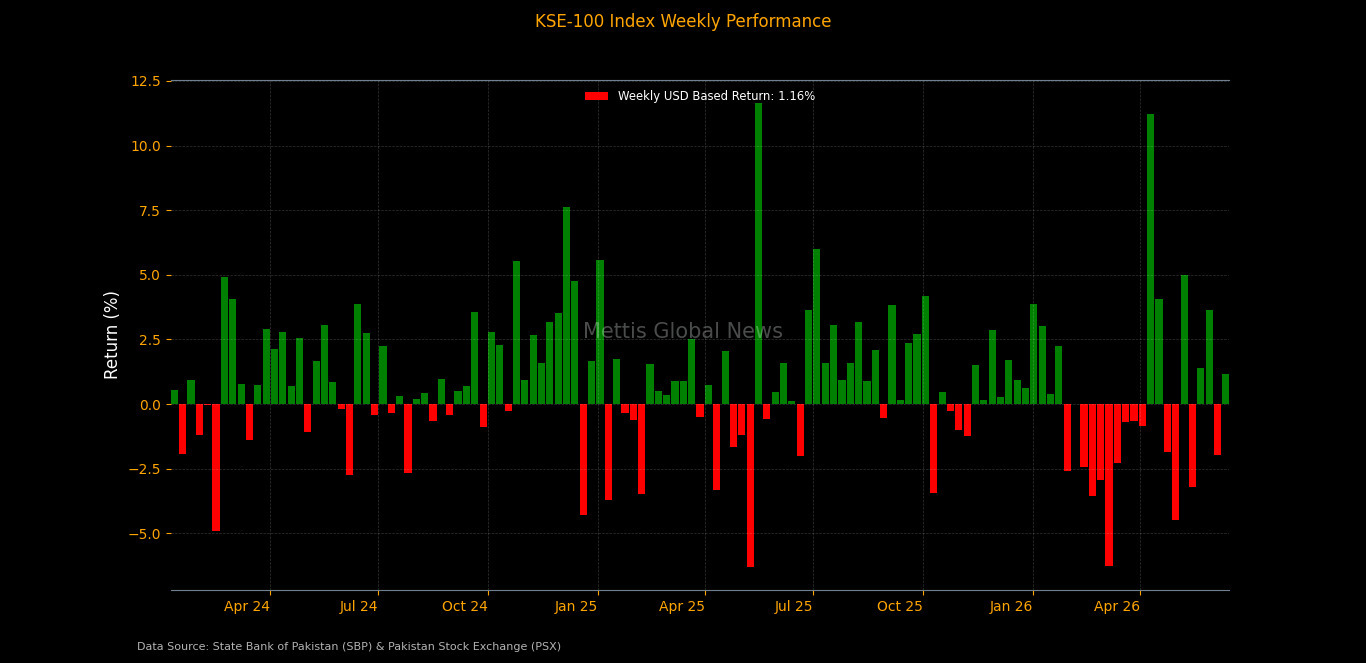
On the macroeconomic front, Pakistan’s
economy grew by 3.7% in FY2025-26, up from 3.18% last year, driven by
improved performance across agriculture, industry, and services, according to
the Economic Survey 2025-26.
The size of the economy increased to Rs126.9tr ($452.1bn),
with agriculture expanding 2.89%, industry 3.51%, and services 4.09%.
The survey highlighted stronger macroeconomic stability,
with per capita income rising to $1,901, the fiscal deficit narrowing to 0.7%
of GDP, and a current account surplus of $72m during July-March FY26.
While higher remittances, private investment, and technology
sector growth supported the economy, challenges remained in the form of a wider
trade deficit, higher unemployment, and climate-related risks.
Pakistan’s
car sales grew 19.3% YoY to 17,660 units in May 2026, supported by strong
demand for Suzuki Alto, Hyundai Elantra, Toyota’s sedan lineup, and HAVAL SUVs,
according to PAMA data.
Commercial vehicles and tractor sales also posted healthy
growth, signaling improving economic and agricultural activity, although
overall car sales fell 19.8% compared to April 2026.
Pakistan’s central government debt rose 9.3% YoY to a record
Rs81.93tr in April 2026, driven by higher domestic and external borrowing
to finance the fiscal deficit.
Pakistan received a record $4.25bn in workers’
remittances in May 2026, up 20.2% MoM and 15.4% YoY, with Saudi Arabia and
the UAE remaining the largest contributors.
Index Movers
Sector-wise performance remained mixed, with gains led by
select heavyweight sectors while pressure persisted in technology, fertilizer,
and E&P stocks.
Top negative contributors: Technology &
Communication (-77.95 pts), Fertilizer (-74.05 pts), Refinery (-26.39 pts),
Automobile Assemblers (-15.05 pts), and Food & Personal Care (-14.64 pts)
were among the key drags on the index.
Top positive contributors: Commercial Banks led gains
with 670.43 points, followed by Cement (525.01 pts), Power
Generation & Distribution (194.95 pts), and Investment Banks (144.79
pts). Oil & Gas Exploration Companies added 76.35 points, while
Property contributed 108.91 points.
Other supporting sectors included Engineering, Textile
Composite, REITs, Pharmaceuticals, and Chemical stocks, reflecting broad-based
but selective buying interest.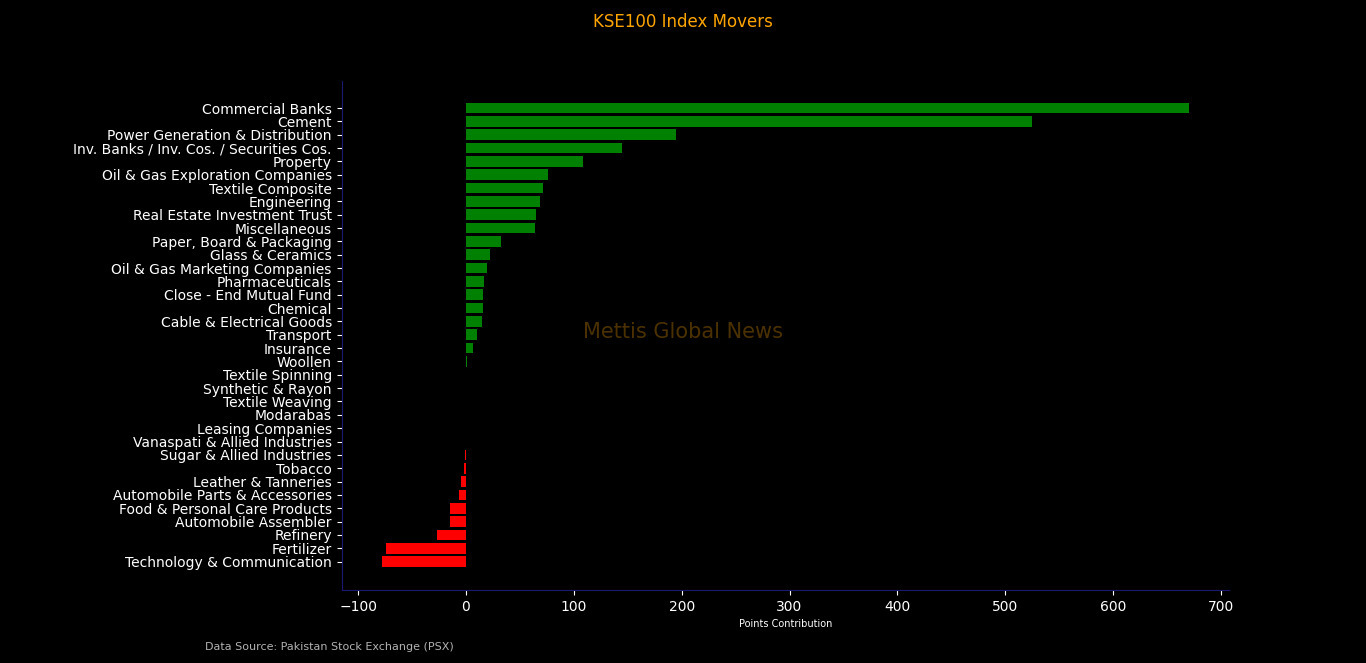
Index gains were led by strong performance in banking,
cement, and energy-related stocks.
Top positive contributors: MEBL (+328.88 pts), LUCK
(+270.56 pts), HUBC (+186.03 pts), UBL (+165.45 pts), ENGROH (+128.65 pts),
JVDC (+108.91 pts), NBP (+105.72 pts), MARI (+101.99 pts), POL (+94.32 pts),
and DGKC (+69.84 pts).
Other notable gainers included PSEL, TPLRF1, ILP, HBL, MLCF,
ISL, BOP, CHCC, BAFL, KOHC, FCCL, and BAHL, reflecting strength in cyclicals
and financials.
Top laggards: MCB (-111.07 pts), PPL (-67.63 pts),
PTC (-60.56 pts), OGDC (-52.32 pts), FFC (-44.82 pts), EFERT (-44.74 pts),
SAZEW (-28.78 pts), ATRL (-23.03 pts), TRG (-22.68 pts), SYS (-4.94 pts), and
NESTLE (-4.79 pts) were among major drags.
Weakness was also seen in refinery, fertilizer, technology,
and selected consumer stocks, indicating profit-taking after prior gains.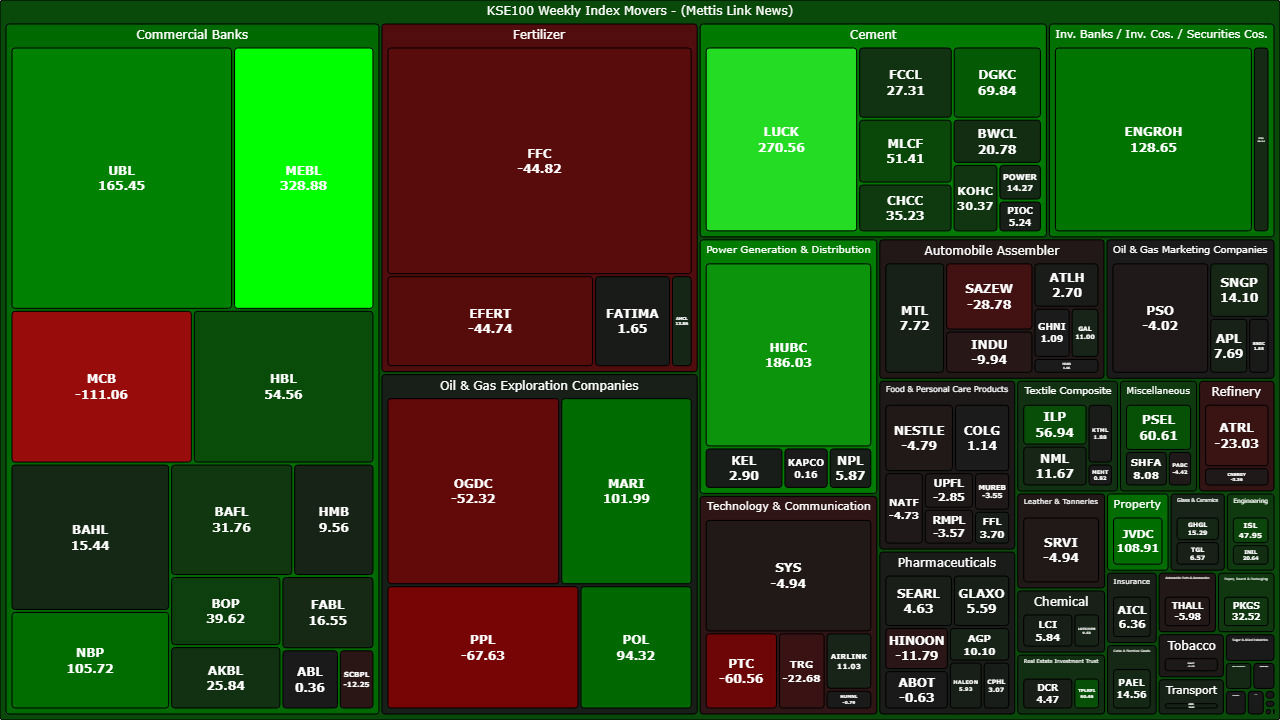
FIPI/LIPI
Foreign investors remained net sellers during the week, with
net foreign outflows of Rs4.69bn ($16.86m) in the equity market.
Foreign corporates led selling with Rs5.27bn outflow,
while overseas Pakistanis recorded net buying of Rs582.88m, partially
offsetting pressure. Foreign individuals remained marginal sellers.
On the local side, individuals dominated buying with Rs3.63bn,
followed by broker proprietary trading (Rs816.66m) and mutual funds (Rs523.67m).
Insurance companies and companies also added net inflows.
On the selling side, mutual funds in the debt segment and
other organizations remained net sellers, indicating portfolio rebalancing
activity.
Overall, domestic liquidity remained the key driver of
market stability, while foreign flows stayed cautious amid global uncertainty._20260613091150747_70c8c2.jpeg)
Copyright Mettis Link News
Related News


_20260529073616622_a5048c.jpeg?width=280&height=140&format=Webp)
| Name | Price/Vol | %Chg/NChg |
|---|---|---|
| KSE100 | 179,927.05 365.01M | -1.27% -2314.73 |
| ALLSHR | 109,270.69 838.76M | -1.19% -1312.98 |
| KSE30 | 53,705.71 89.34M | -1.33% -726.00 |
| KMI30 | 253,531.92 109.38M | -1.32% -3382.29 |
| KMIALLSHR | 70,152.63 543.97M | -1.25% -888.68 |
| BKTi | 50,997.50 18.73M | -1.38% -715.26 |
| OGTi | 36,216.08 8.18M | -1.21% -443.50 |
| Symbol | Bid/Ask | High/Low |
|---|
| Name | Last | High/Low | Chg/%Chg |
|---|---|---|---|
| BITCOIN FUTURES | 63,085.00 | 64,680.00 62,605.00 | -1000.00 -1.56% |
| BRENT CRUDE | 78.50 | 79.80 77.28 | 2.49 3.28% |
| RICHARDS BAY COAL MONTHLY | 105.75 | 0.00 0.00 | -1.15 -1.08% |
| ROTTERDAM COAL MONTHLY | 118.00 | 0.00 0.00 | 0.65 0.55% |
| USD RBD PALM OLEIN | 1,135.00 | 1,135.00 1,135.00 | 0.00 0.00% |
| CRUDE OIL - WTI | 73.83 | 75.08 72.61 | 2.42 3.39% |
| SUGAR #11 WORLD | 14.84 | 14.98 14.65 | -0.04 -0.27% |
Chart of the Day
Latest News
Top 5 things to watch in this week
Pakistan Stock Movers
| Name | Last | Chg/%Chg |
|---|
| Name | Last | Chg/%Chg |
|---|