PSX in June

MG News | July 01, 2026 at 03:18 PM GMT+05:00

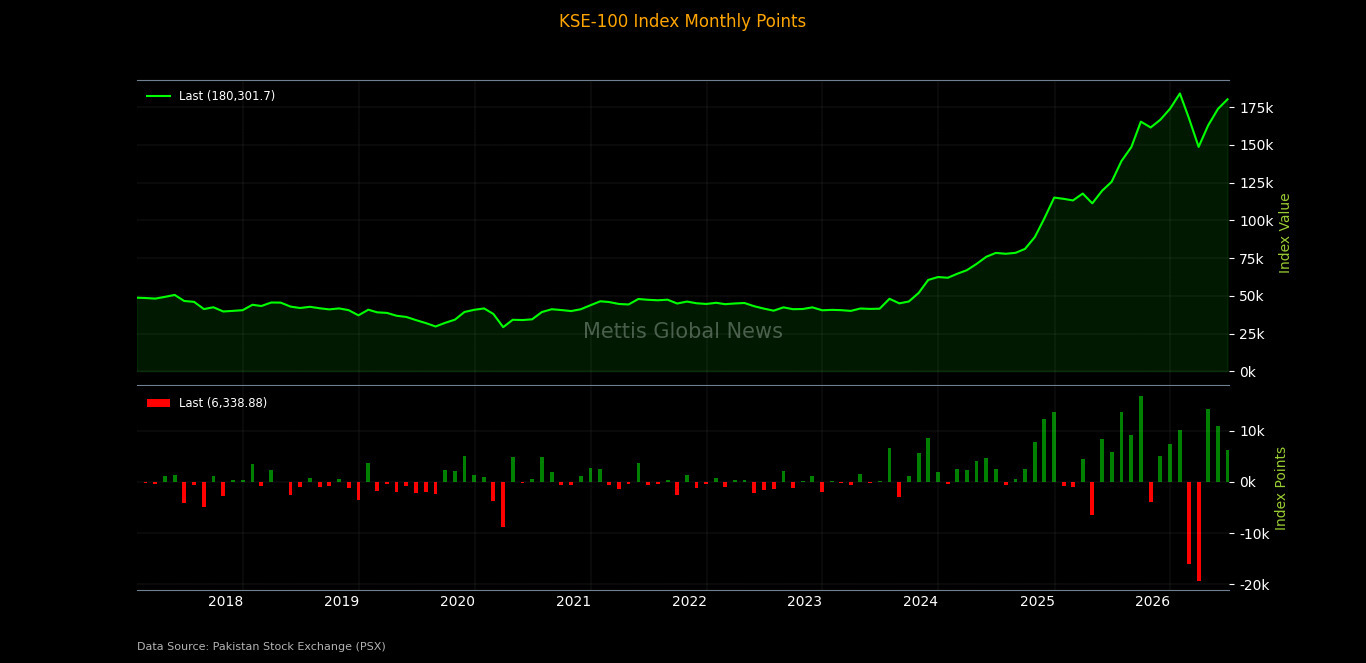
July 01, 2026 (MLN): The KSE-100 Index staged a powerful rally in June 2026, surging 6,338.88 points, equivalent to a gain of 3.64%, to close the month at 180,301.70 points. This marked a significant recovery from the May 2026 closing level of 173,962.82 points.
Compared to
April 2026, when the index rose 9.58%, contributing 14,251 points, June's gains
were slightly more moderate in percentage terms, yet still commanding given the
index was coming off a sharply higher base after two consecutive months of
strong gains.
On a year-on-year basis, the index has surged 43.52% from June 2025's closing level of 125,627.31 points, adding 54,674.39 points over the twelve-month period, a reflection of the sustained re-rating PSX has undergone over the past year.
Market Capitalisation
The KSE-100 Index's market capitalisation rose to Rs5.157 trillion in June 2026, up Rs180.33 billion, or 3.62%, on a month-on-month basis from Rs4.976 trillion in May 2026. On a year-on-year basis, market capitalisation expanded by Rs1.400 trillion, or 37.27%, compared with Rs3.757 trillion in June 2025.
In US dollar terms, the KSE-100 market capitalisation stood at $18.539 billion in June 2026, up $670.19 million, or 3.75%, from $17.869 billion in May 2026. On a year-on-year basis, dollar-denominated market capitalisation rose by $5.30 billion, or 40.04%, from $13.239 billion in June 2025.
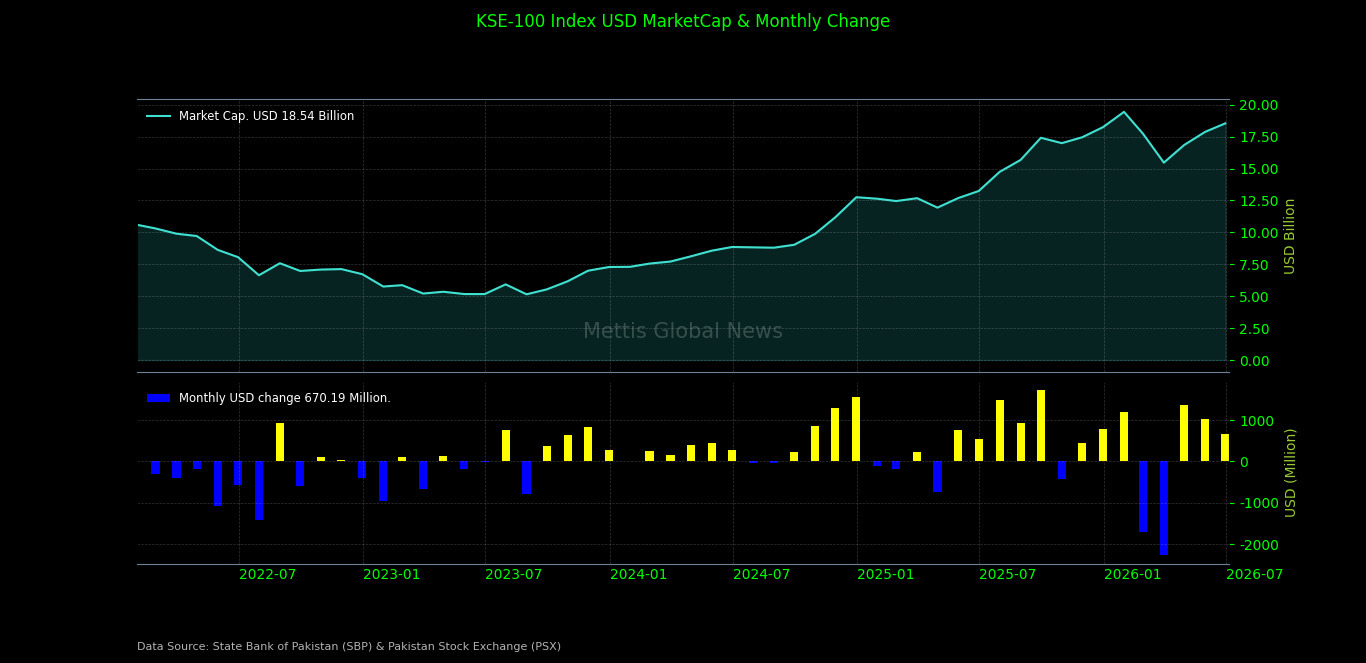
On a returns basis, the KSE-100 actually delivered a marginally higher return in dollar terms than in rupee terms during June: the index's PKR-based return stood at 3.64%, while its USD-based return came in slightly higher at 3.77%.
The gap reflects a modest 0.12% appreciation of the rupee against the dollar during the month (from Rs278.50/USD to Rs278.16/USD), which added to, rather than eroded, dollar returns.
This extends a pattern seen over the preceding two months as well. April's 9.58% rupee-based index return translated into a 9.73% USD return, while May's 6.73% gain became 6.83% in dollar terms.
In each case, currency stability and a slight rupee appreciation meant dollar-based investors captured marginally higher returns than their rupee-based counterparts, the reverse of what happens during periods of rupee depreciation, when dollar returns are typically diluted relative to local returns.
_20260701100824646_037fee.jpeg)
This currency stability meant dollar-denominated market cap gains tracked the index's rupee-based performance closely, without the erosion in USD terms that a depreciating rupee would otherwise impose.
On the economic front, June 2026 was packed with major developments that shaped investor sentiment throughout the month. Inflation accelerated to 11.7% YoY in May, its highest level in 23 months, while the State Bank of Pakistan (SBP) kept the policy rate unchanged at 11.5%.
The government unveiled and later secured parliamentary approval for the FY27 Federal Budget, as the economy posted 3.7% GDP growth in FY26 and the Large-Scale Manufacturing (LSM) sector expanded 6.4% YoY during 10MFY26.
Meanwhile, the government extended austerity measures until June 30, raised Rs1.15 trillion through a Treasury Bill auction, and reduced petrol and diesel prices by Rs7.4 and Rs6.7 per litre, respectively.
On the external front, Pakistan secured its fifth LNG cargo, the current account recorded a surplus of US$459 million in May 2026, while SBP's foreign exchange reserves declined by $1.3 billion to $15.9bn.
Additionally, FBR's tax shortfall widened to Rs868bn during 11MFY26, government borrowing from banks reached Rs3.5 trillion, and overall government debt increased by 5% YoY.
The month also witnessed the signing of the Islamabad Memorandum between the United States and Iran, adding a notable geopolitical development to the broader economic landscape.
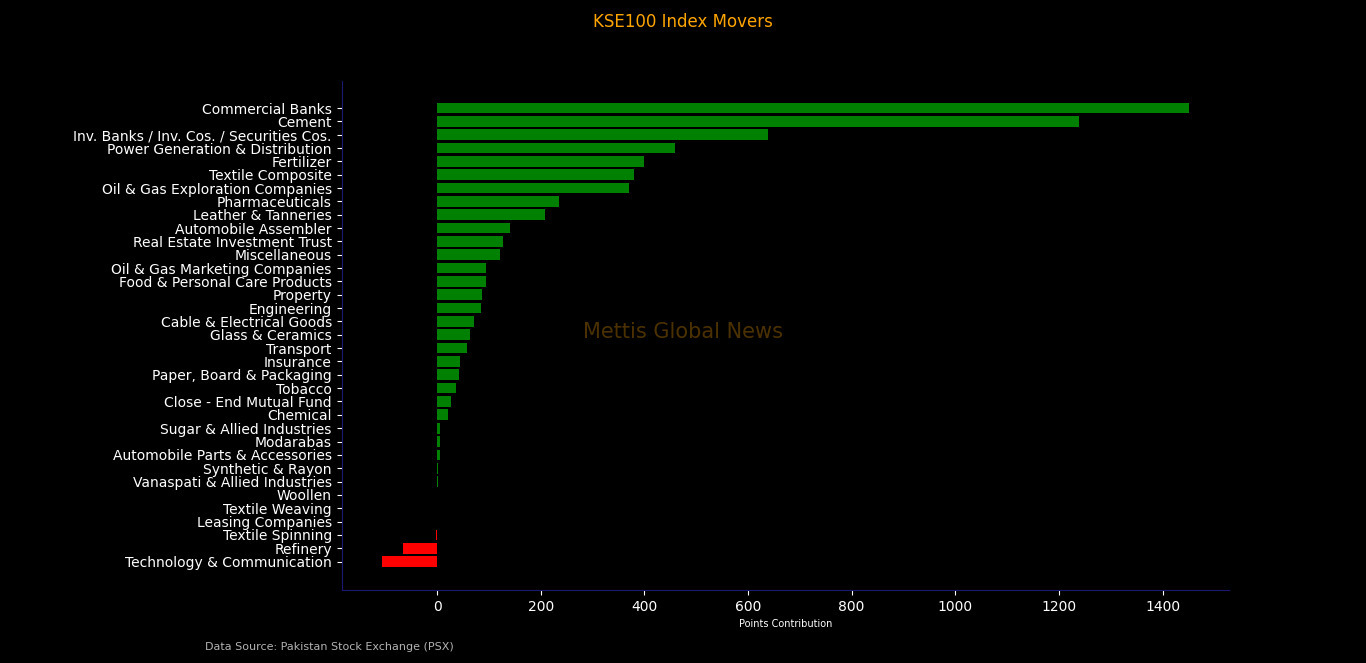
Top Index Movers
Sector-wise
June's rally
was driven by broad-based sector participation, with 32 of the 34 KSE-100
sectors closing in positive territory. Commercial Banks led the charge,
contributing 1,451.16 points to the index, followed by Cement (+1,238.61
points), Investment Banks / Investment Companies / Securities Companies
(+638.27 points), Power Generation & Distribution (+458.81 points), and
Fertilizer (+398.96 points).
Textile Composite (+379.41 points) and Oil & Gas Exploration Companies (+369.94 points) also featured prominently among the top contributors, while Pharmaceuticals (+234.66 points) and Leather & Tanneries (+208.32 points) rounded out the double-digit gainers.
On the downside, only two sectors dragged on the index: Technology & Communication (-106.64 points) and Refinery (-65.04 points). Textile Spinning (-1.37 points) and Leasing Companies (-0.01 points) posted only marginal declines.
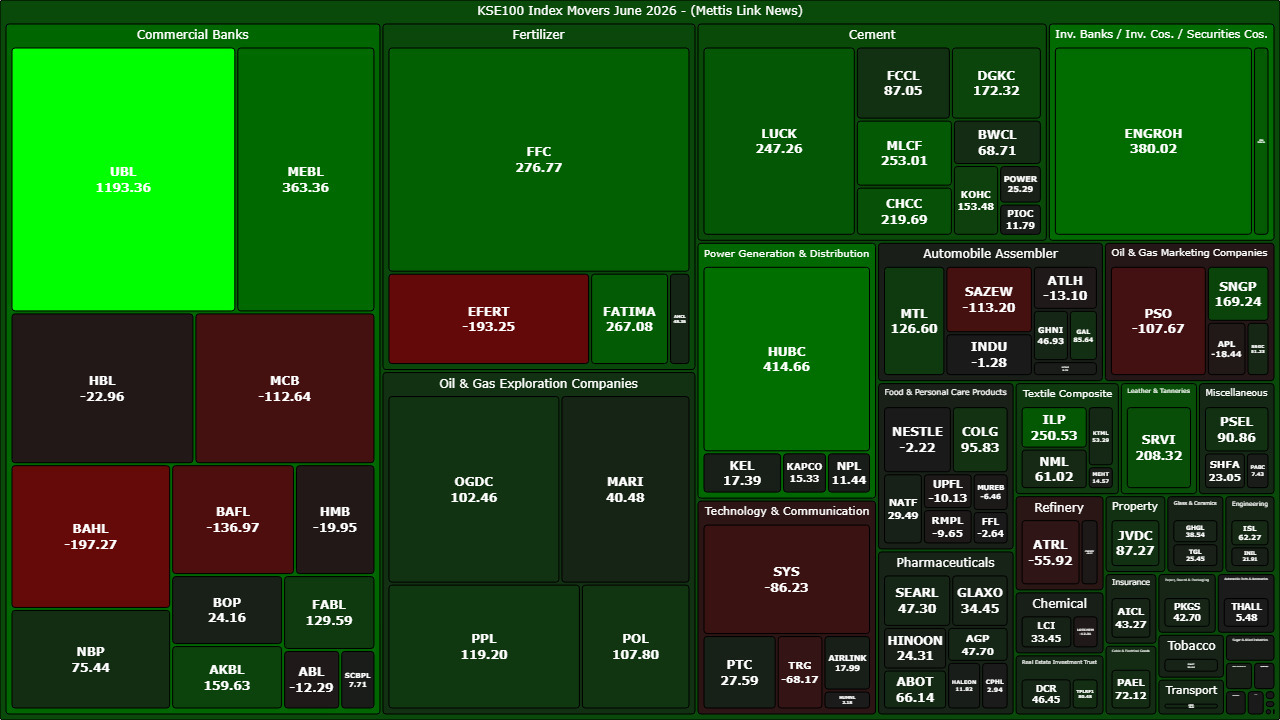
Scrip-wise
At the
individual scrip level, United Bank Limited (UBL) was the single largest
contributor, adding 1,193.36 points on its own, followed by Hub Power Company
(HUBC) with 414.66 points, Engro Holdings (ENGROH) with 380.02 points, Meezan
Bank (MEBL) with 363.36 points, and Fauji Fertilizer Company (FFC) with 276.77
points. Fatima Fertilizer (FATIMA), Pakistan Stock Exchange (PSX), Maple Leaf
Cement (MLCF), Ibrahim Fibres (ILP), and Lucky Cement (LUCK) completed the
top-ten list of gainers.
On the flip side, Bank Al Habib (BAHL) was the biggest drag on the index, shaving off 197.27 points, followed by Engro Fertilizers (EFERT) at -193.25 points, Bank Alfalah (BAFL) at -136.97 points, Sazgar Engineering (SAZEW) at -113.20 points, and MCB Bank (MCB) at -112.64 points. Pakistan State Oil (PSO, -107.67 points), Systems Limited (SYS, -86.23 points), TRG Pakistan (TRG, -68.17 points), and Attock Refinery (ATRL, -55.92 points) also featured among the notable laggards, despite the broader market's strength.
FIPI and LIPI
Foreign Investor Portfolio Investment (FIPI)
Foreign investors turned net sellers of Pakistani equities in June 2026, offloading a net Rs50.65 billion ($182.18 million) worth of shares. Foreign Corporates were the primary sellers, posting net outflows of Rs56.80 billion ($204.32 million), by far the largest single driver of the month's foreign selling.
Overseas
Pakistanis, by contrast, were net buyers to the tune of Rs6.14 billion ($22.10
million), partially cushioning the corporate outflow, while Foreign Individuals
recorded a negligible net inflow of Rs9.15 million.
Including a
small net outflow of Rs35.20 million from the debt segment (entirely
attributable to Overseas Pakistanis), the FIPI grand total for June 2026 stood
at a net sell of Rs50.68 billion ($182.31 million).
Local Investor Portfolio Investment (LIPI)
On the local side, Companies were the standout net buyers in the equity segment, absorbing Rs63.55 billion ($228.61 million) on a net basis, followed by Mutual Funds with net buying of Rs13.37 billion ($48.08 million).
These inflows more than offset
net selling by Insurance Companies (Rs15.67 billion), Individuals (Rs7.20
billion), Other Organizations (Rs4.14 billion), and Banks/DFIs (Rs1.51
billion), while Broker Proprietary Trading and NBFCs posted marginal net buying
of Rs2.22 billion and Rs27.91 million, respectively.
On a net basis, local investors absorbed the entire foreign equity outflow, with LIPI's equity segment posting net buying of Rs50.65 billion ($182.18 million) for the month, a near-exact mirror image of the FIPI equity outflow.
Including the
debt segment, where Banks/DFIs were the largest net buyers at Rs10.81 billion,
partially offset by Mutual Funds' net selling of Rs16.22 billion, the LIPI
grand total came in at a net buy of Rs50.68 billion ($182.31 million).
The near-perfect offset between foreign selling and local buying underscores a familiar pattern for PSX in recent months: domestic institutional flows, led by corporates and mutual funds, continue to provide a durable floor for the market even as foreign portfolio investors remain net sellers.
_20260701100815333_ae5eb4.jpeg)
Related News

_20250922121949099_e67d18.webp?width=280&height=140&format=Webp)
| Name | Price/Vol | %Chg/NChg |
|---|---|---|
| KSE100 | 171,021.20 228.53M | -0.42% -718.25 |
| ALLSHR | 103,836.39 572.65M | -0.41% -422.85 |
| KSE30 | 50,951.99 89.47M | -0.52% -264.77 |
| KMI30 | 240,633.87 93.99M | -0.31% -756.80 |
| KMIALLSHR | 66,572.75 300.61M | -0.28% -185.59 |
| BKTi | 48,673.23 31.18M | -0.70% -343.86 |
| OGTi | 33,702.25 6.35M | -0.61% -205.57 |
| Symbol | Bid/Ask | High/Low |
|---|
| Name | Last | High/Low | Chg/%Chg |
|---|---|---|---|
| BITCOIN FUTURES | 64,070.00 | 64,215.00 64,070.00 | -145.00 -0.23% |
| BRENT CRUDE | 98.70 | 101.19 95.13 | -1.99 -1.98% |
| RICHARDS BAY COAL MONTHLY | 105.75 | 0.00 0.00 | -1.55 -1.44% |
| ROTTERDAM COAL MONTHLY | 121.10 | 121.10 121.10 | 0.70 0.58% |
| USD RBD PALM OLEIN | 1,175.00 | 1,175.00 1,175.00 | 0.00 0.00% |
| CRUDE OIL - WTI | 90.47 | 92.83 87.68 | -1.72 -1.87% |
| SUGAR #11 WORLD | 14.76 | 14.79 14.54 | 0.07 0.48% |
Chart of the Day
Latest News
Top 5 things to watch in this week
Pakistan Stock Movers
| Name | Last | Chg/%Chg |
|---|
| Name | Last | Chg/%Chg |
|---|