PSX in FY26: Rides Out the Storm

MG News | July 01, 2026 at 08:26 PM GMT+05:00

July 01, 2026 (MLN): FY26 will be remembered as another landmark year for Pakistan's equity market. Riding on improving macroeconomic fundamentals and renewed investor confidence, the KSE-100 Index surged by 54,674 points, or 43.52%, to settle at a record 180,301.70 points.
The rally extended the PSX's winning streak to three consecutive years, delivering a staggering cumulative return of 335% in PKR terms and 347% in USD terms over FY24-FY26.
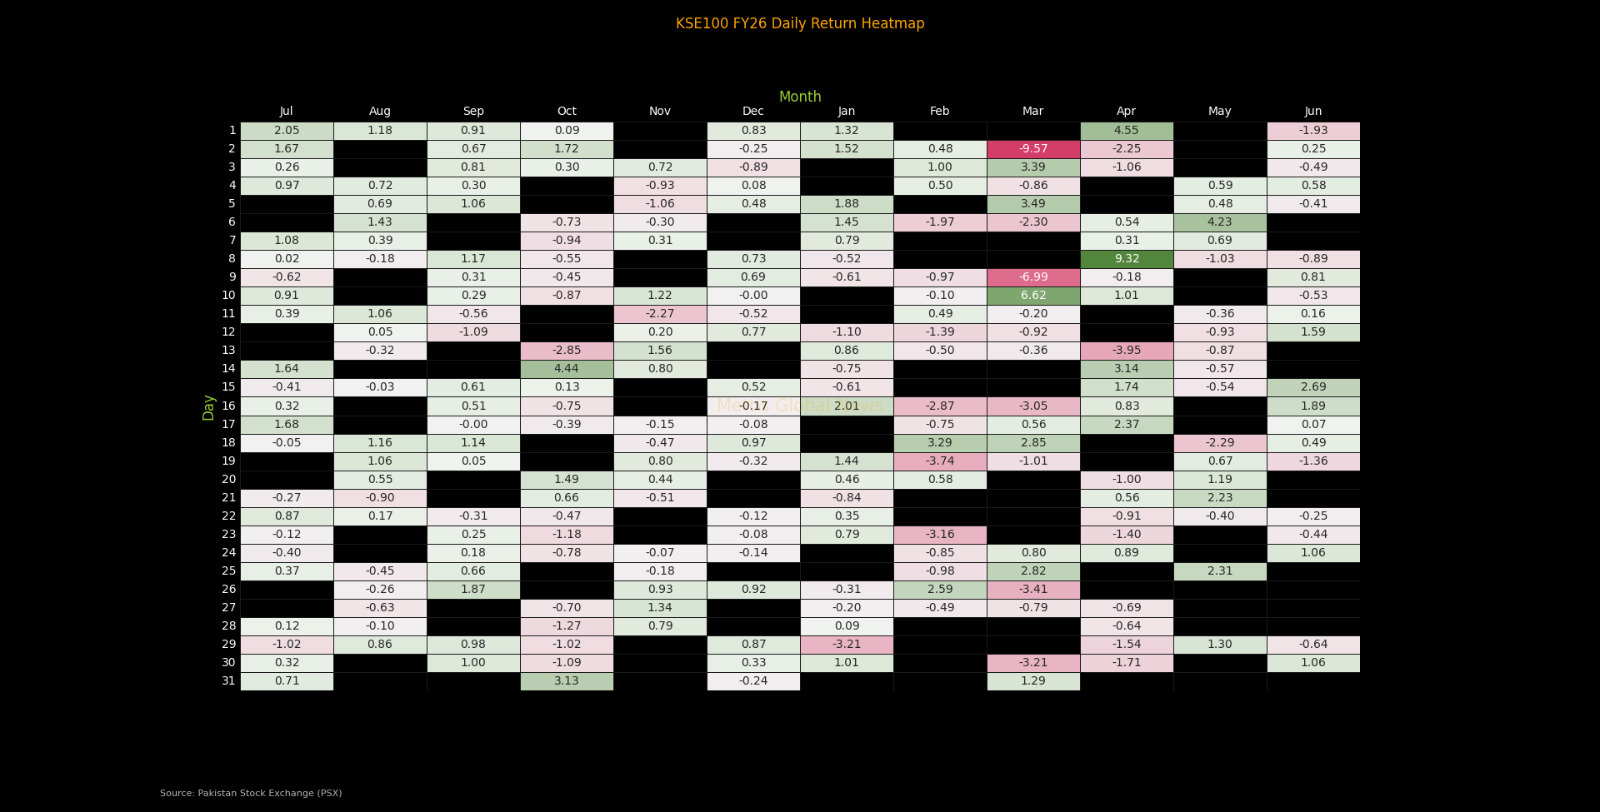
During the year, the volatility was concentrated in a roughly six-week window between mid-February and early April 2026.
The single worst session of the year came on March 2, 2026, when the index fell 9.57%, its largest one-day decline on record, as the Israel-US strikes on Iran triggered a spike in global oil prices and stoked fears over Pakistan's import bill, given the country imports more than 80% of its energy needs.
Selling pressure persisted through the following weeks, with declines of 6.99% (Jan 9), 3.74% (Jan 19), 3.41% (Feb 26), 3.21% (Jan 29), 3.16% (Feb 23) and 3.05% (Feb 16) punctuating the sell-off that ultimately dragged the index to its FY26 low of 146,480 points on March 9, 2026.
The recovery was just as abrupt. The index staged its best single session of the year on April 8, 2026, gaining 9.32%, as fears around the UAE deposit repayment and oil-price pressure eased following proactive government measures and fresh financial support from Saudi Arabia.
Other large up-days followed in quick succession, 6.62% (Mar 10, the session immediately after the yearly low), 4.55% (Apr 1), 4.23% (May 6), 3.39% (Sep 3), 3.29% (Feb 18) and 2.69%, coinciding with news of a preliminary US-Iran understanding, as the market clawed back from the March trough to close FY26 just 5% below its all-time intraday high closing of 189,167 points (Jan 23, 2026) and 23% above its March 9 low.
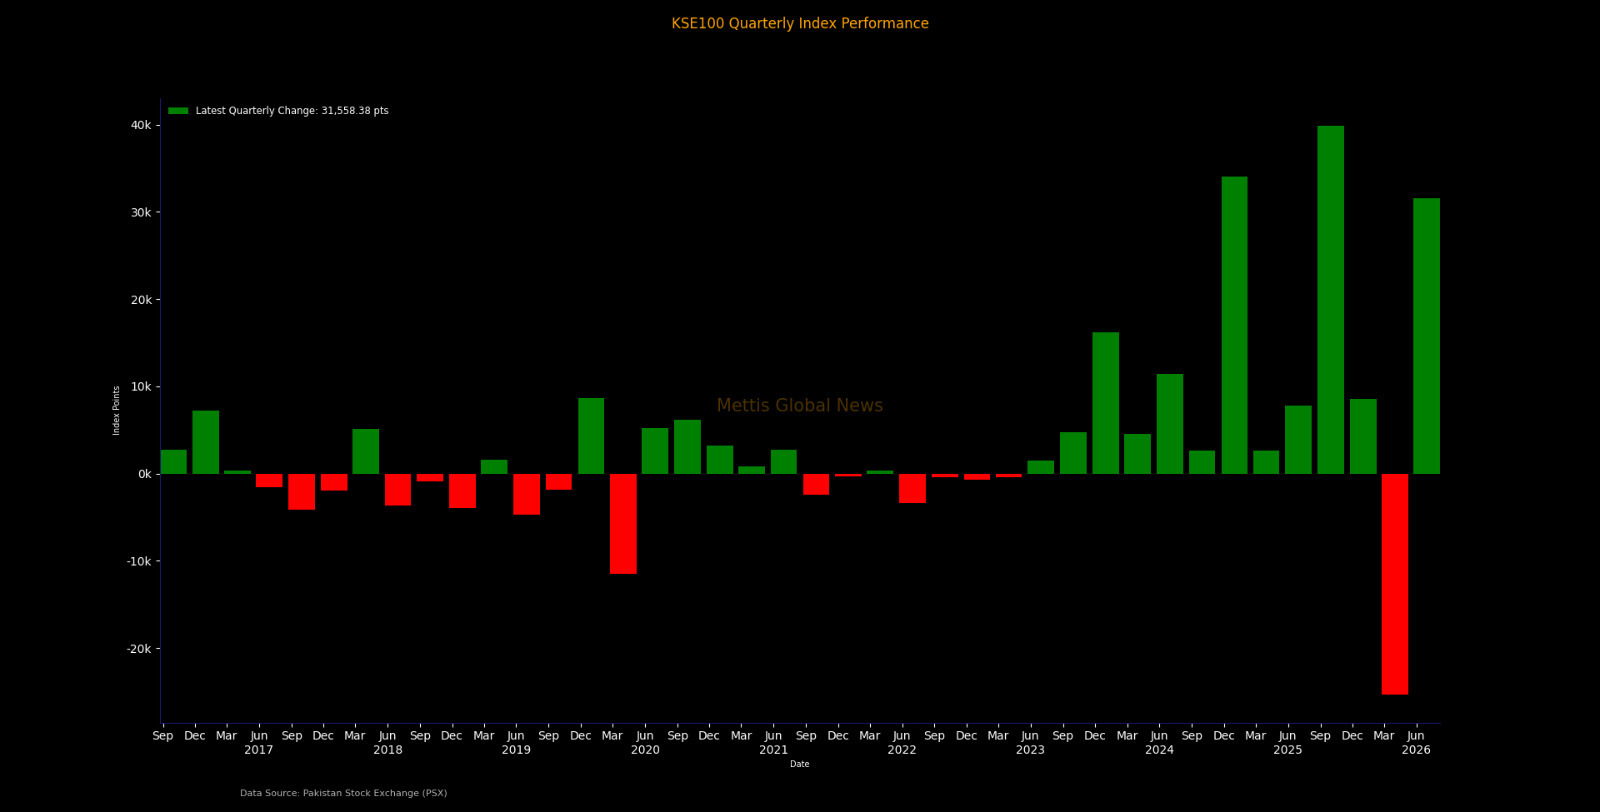
Compared with FY25's quarterly path, Q1FY25 (+3.40%), Q2FY25 (+41.93%), Q3FY25 (+2.33%) and Q4FY25 (+6.64%), FY26 was a considerably more volatile year. Q1FY26's 31.73% gain was nearly ten times FY25's corresponding quarter.
In comparison, Q3FY26's 14.54% decline stands out as the single largest quarterly points erosion (-25,311 points) in the index's history on record, eclipsing even the COVID-19 crash quarter of Mar-2020 (-11,503.45 points).
The Q4FY26 rebound of +31,558.38 points was the third-largest quarterly points gain on record, behind only Q1FY26 itself and the Dec-2024 quarter's +34,012.70 points.
On a half-yearly basis, 1HFY26 (Jul-Dec 2025) delivered a return of 38.55% (+48,427.01 points, closing at 174,054.32), while 2HFY26 (Jan-Jun 2026) added a comparatively modest 3.59% (+6,247.38 points, closing at 180,301.70).
This mirrors, but is more pronounced than, the FY25 pattern, where 1HFY25 returned 46.76% (+36,681.94 points), and 2HFY25 returned 9.12% (+10,500.41 points).
In both years, the first half of the fiscal year carried the bulk of the annual gain, with the second half absorbing most of the volatility, in FY26's case, an outright geopolitical shock.
 - Copy_20260701115003355_e7bea8.jpeg)
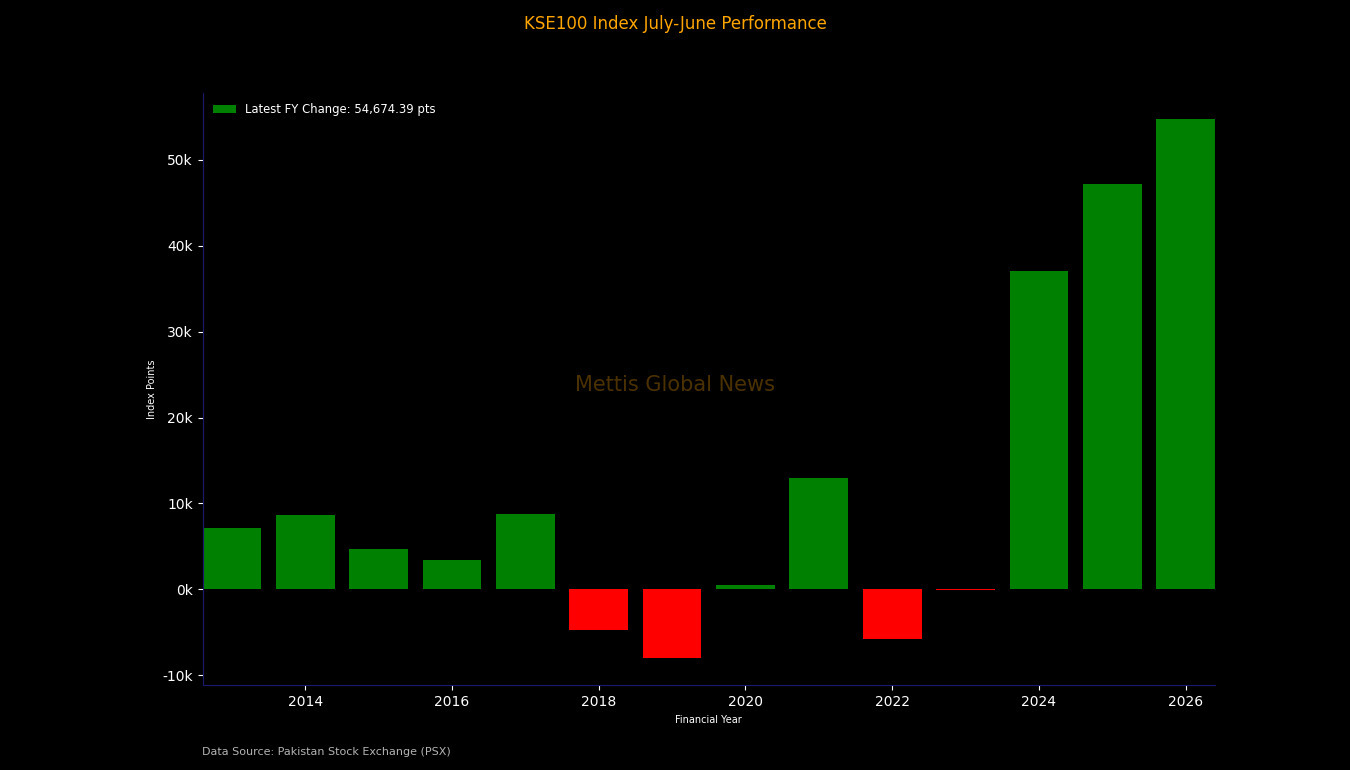
On an annual basis, FY26's +54,674.39 point gain is the largest annual points addition the KSE-100 has ever recorded, surpassing FY25's +47,182.35 points and FY24's +36,992.27 points.
This was mainly due to macro stabilisation under the IMF programme, falling interest rates and improving external-account metrics that have run since FY23's low base.
This is the third straight fiscal year of a positive, accelerating points gain, FY24, FY25 and FY26 together have added roughly 138,849 points to the index, versus a starting base of 41,452.69 points at the end of FY23.
Total PSX market capitalisation stood at approximately Rs20.198 trillion at FY26's close (Jun 30, 2026), up from Rs15,237 billion (Rs15.237 trillion) at the close of FY25 (Jun 30, 2025), a YoY increase of roughly 32.6% in PKR terms.
The improvement in market cap in USD terms is further underpinned by relative rupee stability: the PKR appreciated 2.0% YoY against the USD in FY26.
Pakistan's Real Effective Exchange Rate (REER) index stood at 106.15 as of May 2026, above its 10-year average of 102.59, signalling the rupee is trading somewhat firmer than its long-run fair-value range, a dynamic that has supported USD-denominated equity returns without requiring further currency depreciation.
USD-based return
FY26's 46.41% USD return compares with 57.09% in FY25, 94.44% in FY24, -28.52% in FY23 and -32.54% in FY22, meaning FY26 marks a third consecutive year of strong positive USD returns, a run not seen since the FY13-FY17 period when the index posted five straight years of double-digit USD gains.
_20260701115132928_261f6b.jpeg)
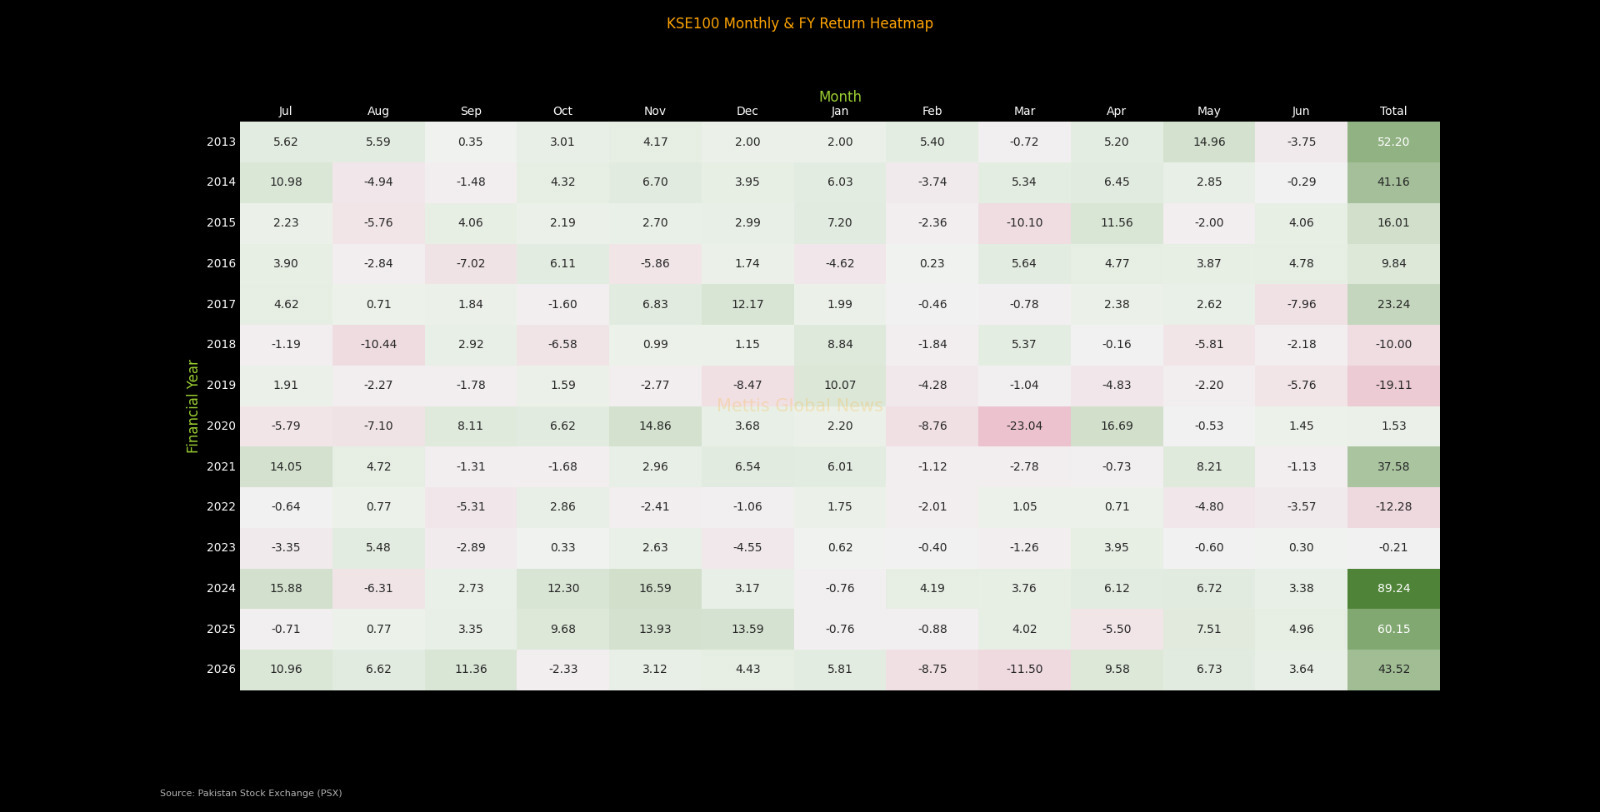
The monthly-and-FY return heatmaps for both PKR and USD terms show FY26's monthly pattern was front-loaded and back-half volatile.
In PKR terms, the strongest months were September 2025 (+11.36%), July 2025 (+10.96%) and April 2026 (+9.58%), while the weakest were March 2026 (-11.50%) and February 2026 (-8.75%), together explaining most of the Q3FY26 drawdown.
The USD-return heatmap tells a near-identical story (Sep-25: +11.54%, Jul-25: +11.31%, Apr-26: +9.73%; Mar-26: -11.39%, Feb-26: -8.65%), confirming that currency moves added only marginally to returns most months, with the FY26 PKR/USD total-return gap of under one percentage point in every single month.
This shows a sign of the rupee's
relative stability through even the most turbulent equity-market weeks of the
year.
Viewed across the full 13-year history in the heatmap, FY26's PKR return of 43.52% and USD return of 46.41% rank among the better fiscal years of the past decade, behind only FY24 (89.24% PKR/94.44% USD) and FY25 (60.15% PKR/57.09% USD).
The three-year FY24-FY26 run captured in these heatmaps represents the strongest sustained stretch for Pakistani equities since the data series begins in FY13.
Key Events and Macro Backdrop
FY26's rally and its interruption were driven by a clear sequence of events.
A defence pact with Saudi Arabia
around September 2025 helped underpin sentiment early in the year, alongside
improving economic indicators, even as floods in July-August 2025 posed a
growth headwind.
In addition, rising Pakistan-Afghanistan border
tensions in October 2025 introduced an early bout of caution.
The IMF Executive Board's approval
of a tranche disbursement around December 2025 reinforced the
macro-stabilisation narrative that had carried the index through 1HFY26's
38.55% half-year return.
The onset of corporate results
season in January 2026 brought lower-than-expected earnings and dividends from
several heavyweights, contributing to the index's pullback from its Jan 23,
2026 all-time high of 189,167 points.
The escalation to open Israel-US
strikes on Iran in February-March 2026 was the year's defining shock, driving
Brent crude to over $110 per bbl at its peak.
Concerns were compounded when
Pakistan repaid US$3.5bn in UAE deposits in April 2026, but the market's fears
were subsequently offset by proactive petroleum-demand management, fresh
financial support secured from Saudi Arabia, and Pakistan's return to international
capital markets with a US$750mn Eurobond (April 2026) and a US$250mn Panda bond
(May 2026).
A ceasefire with an MOU between the US and Iran, combined with record monthly workers' remittances of $4.3bn in May 2026, powered the index back through 168,000 points in mid-April and toward the 180,000-point level by FY26's close.
On the economic front, FY26 marked a year of macroeconomic stabilization and gradual recovery, providing a supportive backdrop for the Pakistan Stock Exchange.
The economy expanded by 3.7%, while Large-Scale Manufacturing (LSM) rebounded with 6.4% YoY growth during 10MFY26.
Inflation remained volatile, climbing to 11.1% by the end of the fiscal year, prompting the State Bank of Pakistan (SBP) to maintain a relatively tight monetary stance, with the policy rate ending FY26 at 11.5%.
The external sector improved considerably as the current account returned to surplus, supported by record-high workers' remittances, while SBP's foreign exchange reserves recovered to around $16 billion despite external debt repayments.
Fiscal consolidation also gained momentum, with the government unveiling the FY27 Federal Budget, extending austerity measures, reducing the fiscal deficit, and advancing reforms under the IMF programme.
During the year, Pakistan successfully re-entered international debt markets through Eurobond and Panda Bond issuances, secured additional external financing, and completed the privatization of PIA, reinforcing investor confidence.
Top Index Movers
Sector-Wise
Commercial Banks remained the dominant driver of the KSE-100 in FY26, contributing +21,613.70 points to the index. This was by far the largest sector contribution during the year.
Other major contributors included Fertilizer (+7,714.17 points), Oil & Gas Exploration Companies (+6,151.56 points), Cement (+4,050.63 points), Investment Banks / Investment Companies / Securities Companies (+3,701.45 points), Power Generation & Distribution (+3,556.34 points), and Technology & Communication (+2,299.16 points).
On the downside, Oil & Gas Marketing Companies (-189.34 points) and Glass & Ceramics (-145.98 points) were the largest sectoral drags. However, their negative impact was relatively small compared with the gains delivered by the leading sectors.
_20260701115107239_a1eec5.jpeg)
Scrip-Wise Movers
Fauji Fertilizer (FFC) emerged as the single largest positive contributor to the FY26 rally, adding +6,301.70 points to the KSE-100. It was closely followed by United Bank (UBL, +6,080.76 points), Hub Power Company (HUBC, +3,768.11 points), Engro Holdings (ENGROH, +3,440.93 points), and Meezan Bank (MEBL, +3,256.09 points).
Other notable contributors included Oil & Gas Development Company (OGDC, +2,876.04 points), Habib Bank (HBL, +2,660.35 points), MCB Bank (+2,155.75 points), National Bank of Pakistan (NBP, +2,145.41 points), and Pakistan Petroleum (PPL, +1,861.92 points).
The top contributors were largely concentrated in commercial banks, fertilizer, and exploration & production (E&P) companies, reflecting the same sectoral leadership seen in the broader index performance.
Among the laggards, Pakgen Power (PKGP) was the largest points drag, subtracting -564.45 points from the index. It was followed by Lotte Chemical Pakistan (LCI, -223.21 points), Pakistan State Oil (PSO, -210.40 points), Unity Foods (UNITY, -205.62 points), and DHPL (-193.11 points).
_20260701114941243_b9b4d9.jpeg)
FIPI and LIPI
Foreign investors remained aggressive net sellers, pulling a massive PKR 237.70 billion (approximately USD 847.72 million) out of the market. This capital flight was heavily driven by Foreign Corporates in the equity segment, who recorded a substantial net sell-off of PKR 252.09 billion.
Although Overseas Pakistanis provided a small buffer by net-buying PKR 15.47 billion in equities and PKR 86.04 million in debt instruments.
Conversely, the Local Investment Portfolio Investment (LIPI) number reveals that domestic institutions and retail investors stepped up to absorb this heavy selling pressure.
In the equity segment, local buying confidence was anchored by Corporate Companies and retail Individuals, who registered net purchases of PKR 163.48 billion and PKR 92.43 billion, respectively.
Mutual Funds also showed strong bullish sentiment with net inflows of PKR 113.00 billion.
These inflows comfortably countered the capital flowing out from Banks/DFIs (PKR 48.61 billion net sell) and Insurance Companies (PKR 67.65 billion net sell), leaving local equity participants as net buyers of PKR 237.79 billion to match the foreign equity outflow.
Outlook
Several key factors are expected to shape FY27F market sentiment, including the durability of the Iran–US ceasefire and its potential impact on global oil prices; progress on the government’s remaining privatisation pipeline, particularly DISCOs, the Roosevelt Hotel transaction, and the Reko Diq project, following the completed PIA privatisation.
Also, the trajectory of SBP reserves, the IMF programme’s 4th and 5th EFF/RSF reviews and the FY27F primary balance target of 2% of GDP, alongside the FBR revenue goal of Rs15.3tn, now classified as a Quantitative Performance Criterion rather than an Indicative Target.
Pakistan’s continued re-entry into international capital markets through potential Eurobond, Sukuk, or Panda bond issuances is also expected to play a key role in shaping sentiment.
Copyright Mettis Link News
Related News


| Name | Price/Vol | %Chg/NChg |
|---|---|---|
| KSE100 | 171,021.20 228.53M | -0.42% -718.25 |
| ALLSHR | 103,836.39 572.65M | -0.41% -422.85 |
| KSE30 | 50,951.99 89.47M | -0.52% -264.77 |
| KMI30 | 240,633.87 93.99M | -0.31% -756.80 |
| KMIALLSHR | 66,572.75 300.61M | -0.28% -185.59 |
| BKTi | 48,673.23 31.18M | -0.70% -343.86 |
| OGTi | 33,702.25 6.35M | -0.61% -205.57 |
| Symbol | Bid/Ask | High/Low |
|---|
| Name | Last | High/Low | Chg/%Chg |
|---|---|---|---|
| BITCOIN FUTURES | 64,070.00 | 64,215.00 64,070.00 | -145.00 -0.23% |
| BRENT CRUDE | 98.70 | 101.19 95.13 | -1.99 -1.98% |
| RICHARDS BAY COAL MONTHLY | 105.75 | 0.00 0.00 | -1.55 -1.44% |
| ROTTERDAM COAL MONTHLY | 121.10 | 121.10 121.10 | 0.70 0.58% |
| USD RBD PALM OLEIN | 1,175.00 | 1,175.00 1,175.00 | 0.00 0.00% |
| CRUDE OIL - WTI | 90.47 | 92.83 87.68 | -1.72 -1.87% |
| SUGAR #11 WORLD | 14.76 | 14.79 14.54 | 0.07 0.48% |
Chart of the Day
Latest News
Top 5 things to watch in this week
Pakistan Stock Movers
| Name | Last | Chg/%Chg |
|---|
| Name | Last | Chg/%Chg |
|---|