USD/PKR reaches oversold territory
Abdur Rahman | February 04, 2024 at 05:38 PM GMT+05:00

February 04, 2024 (MLN): The Pakistani rupee (PKR) has reversed its course against the US Dollar in the past few months after plunging to record lows and finishing 2023 as one of Asia’s worst performers.
The USD/PKR has dropped as much as 9% or Rs27.7 since its peak in September 2023. However, it is now approaching oversold levels as its relative strength index (RSI), a widely tracked measure of momentum, approaches the extreme ends of the meter.
The 14-day RSI for USD/PKR has dropped to 10.82, well below the level of 30 typically seen as oversold.
The technical indicator suggests a near-term trend reversal may be in sight, though historical data is not sufficient to support this indication.
There have been just 3 instances since 2000 when the pair dropped below 10; however, the local currency (PKR) was actually higher a month later 67% of the time, with an average gain of more than 2.5%.
To avoid any confusion, this simply means the USD lost even more of its value against PKR despite reaching overly sold levels.
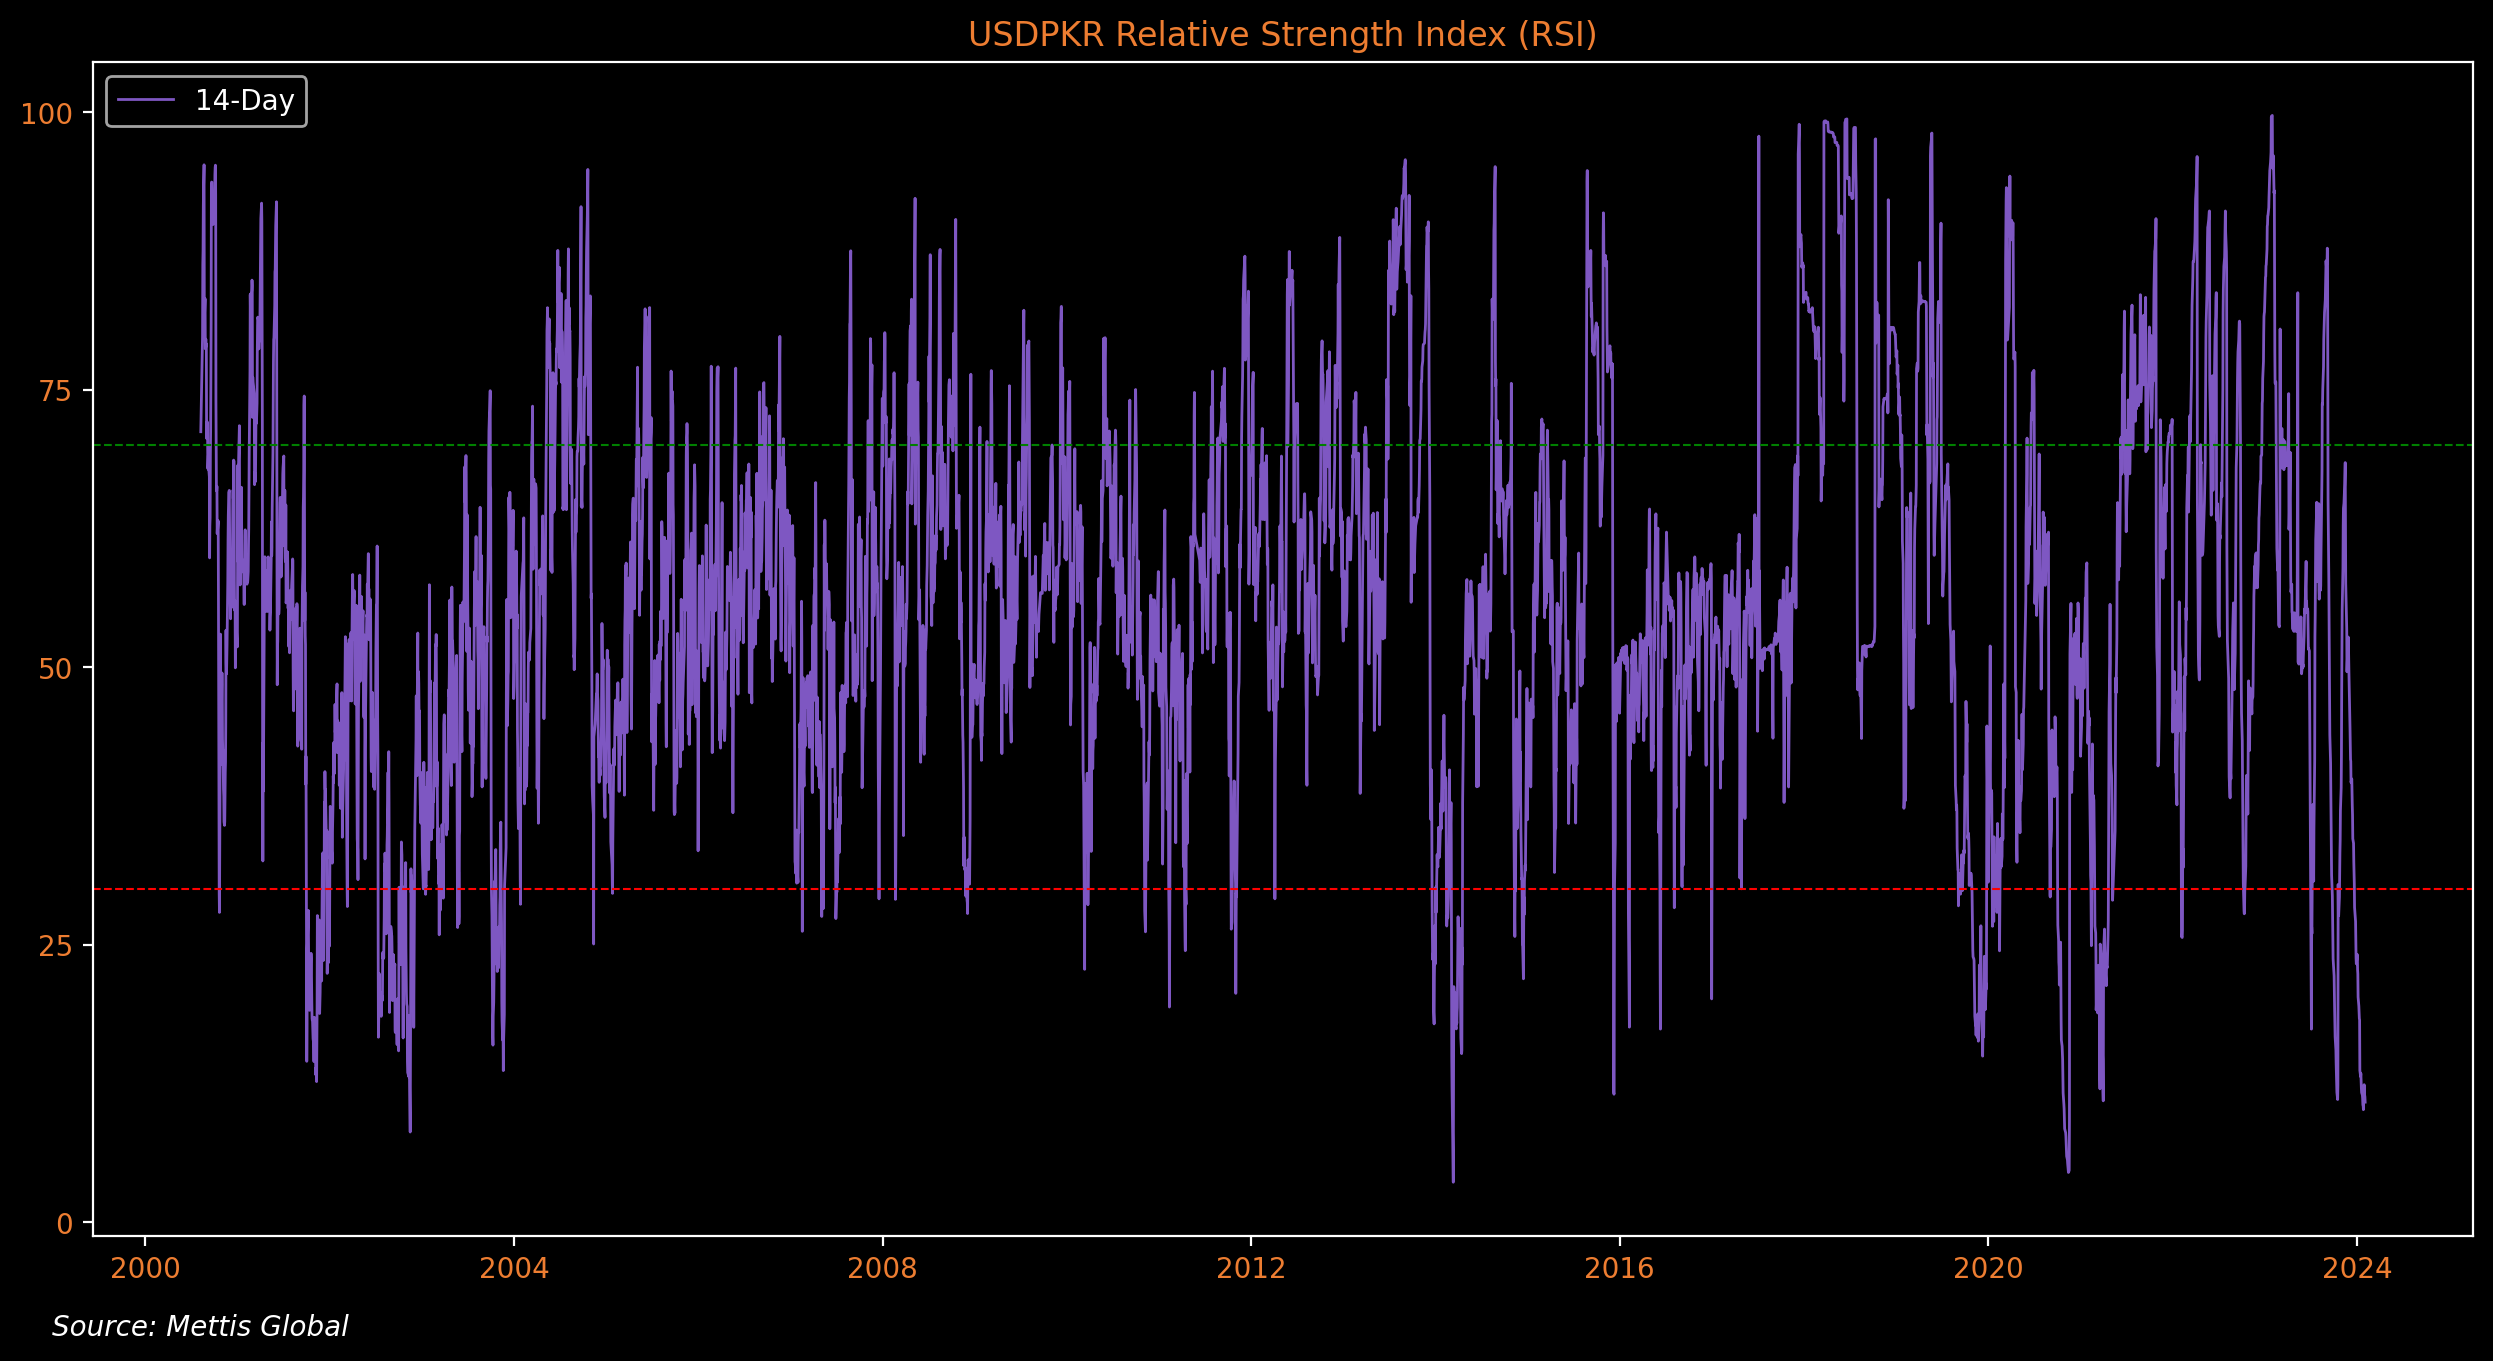
Historic data shows the pair seems to respond better to weekly RSI instead, but more on that later as it currently remains well above oversold levels.
Interestingly, a deeper look into the daily RSI data showed the exchange rate tended to decline further in the short term after the reading fell below 10, before eventually reversing its trend.
Since the RSI can remain in overbought or oversold zones for prolonged periods of time, one can enhance the probability of identifying the trend reversal once the momentum picks up.
For instance, in these three scenarios, once the RSI crossed above 60, which is one way of measuring the acceleration of momentum, on average the PKR lost 3.7% against the USD over the next three months.
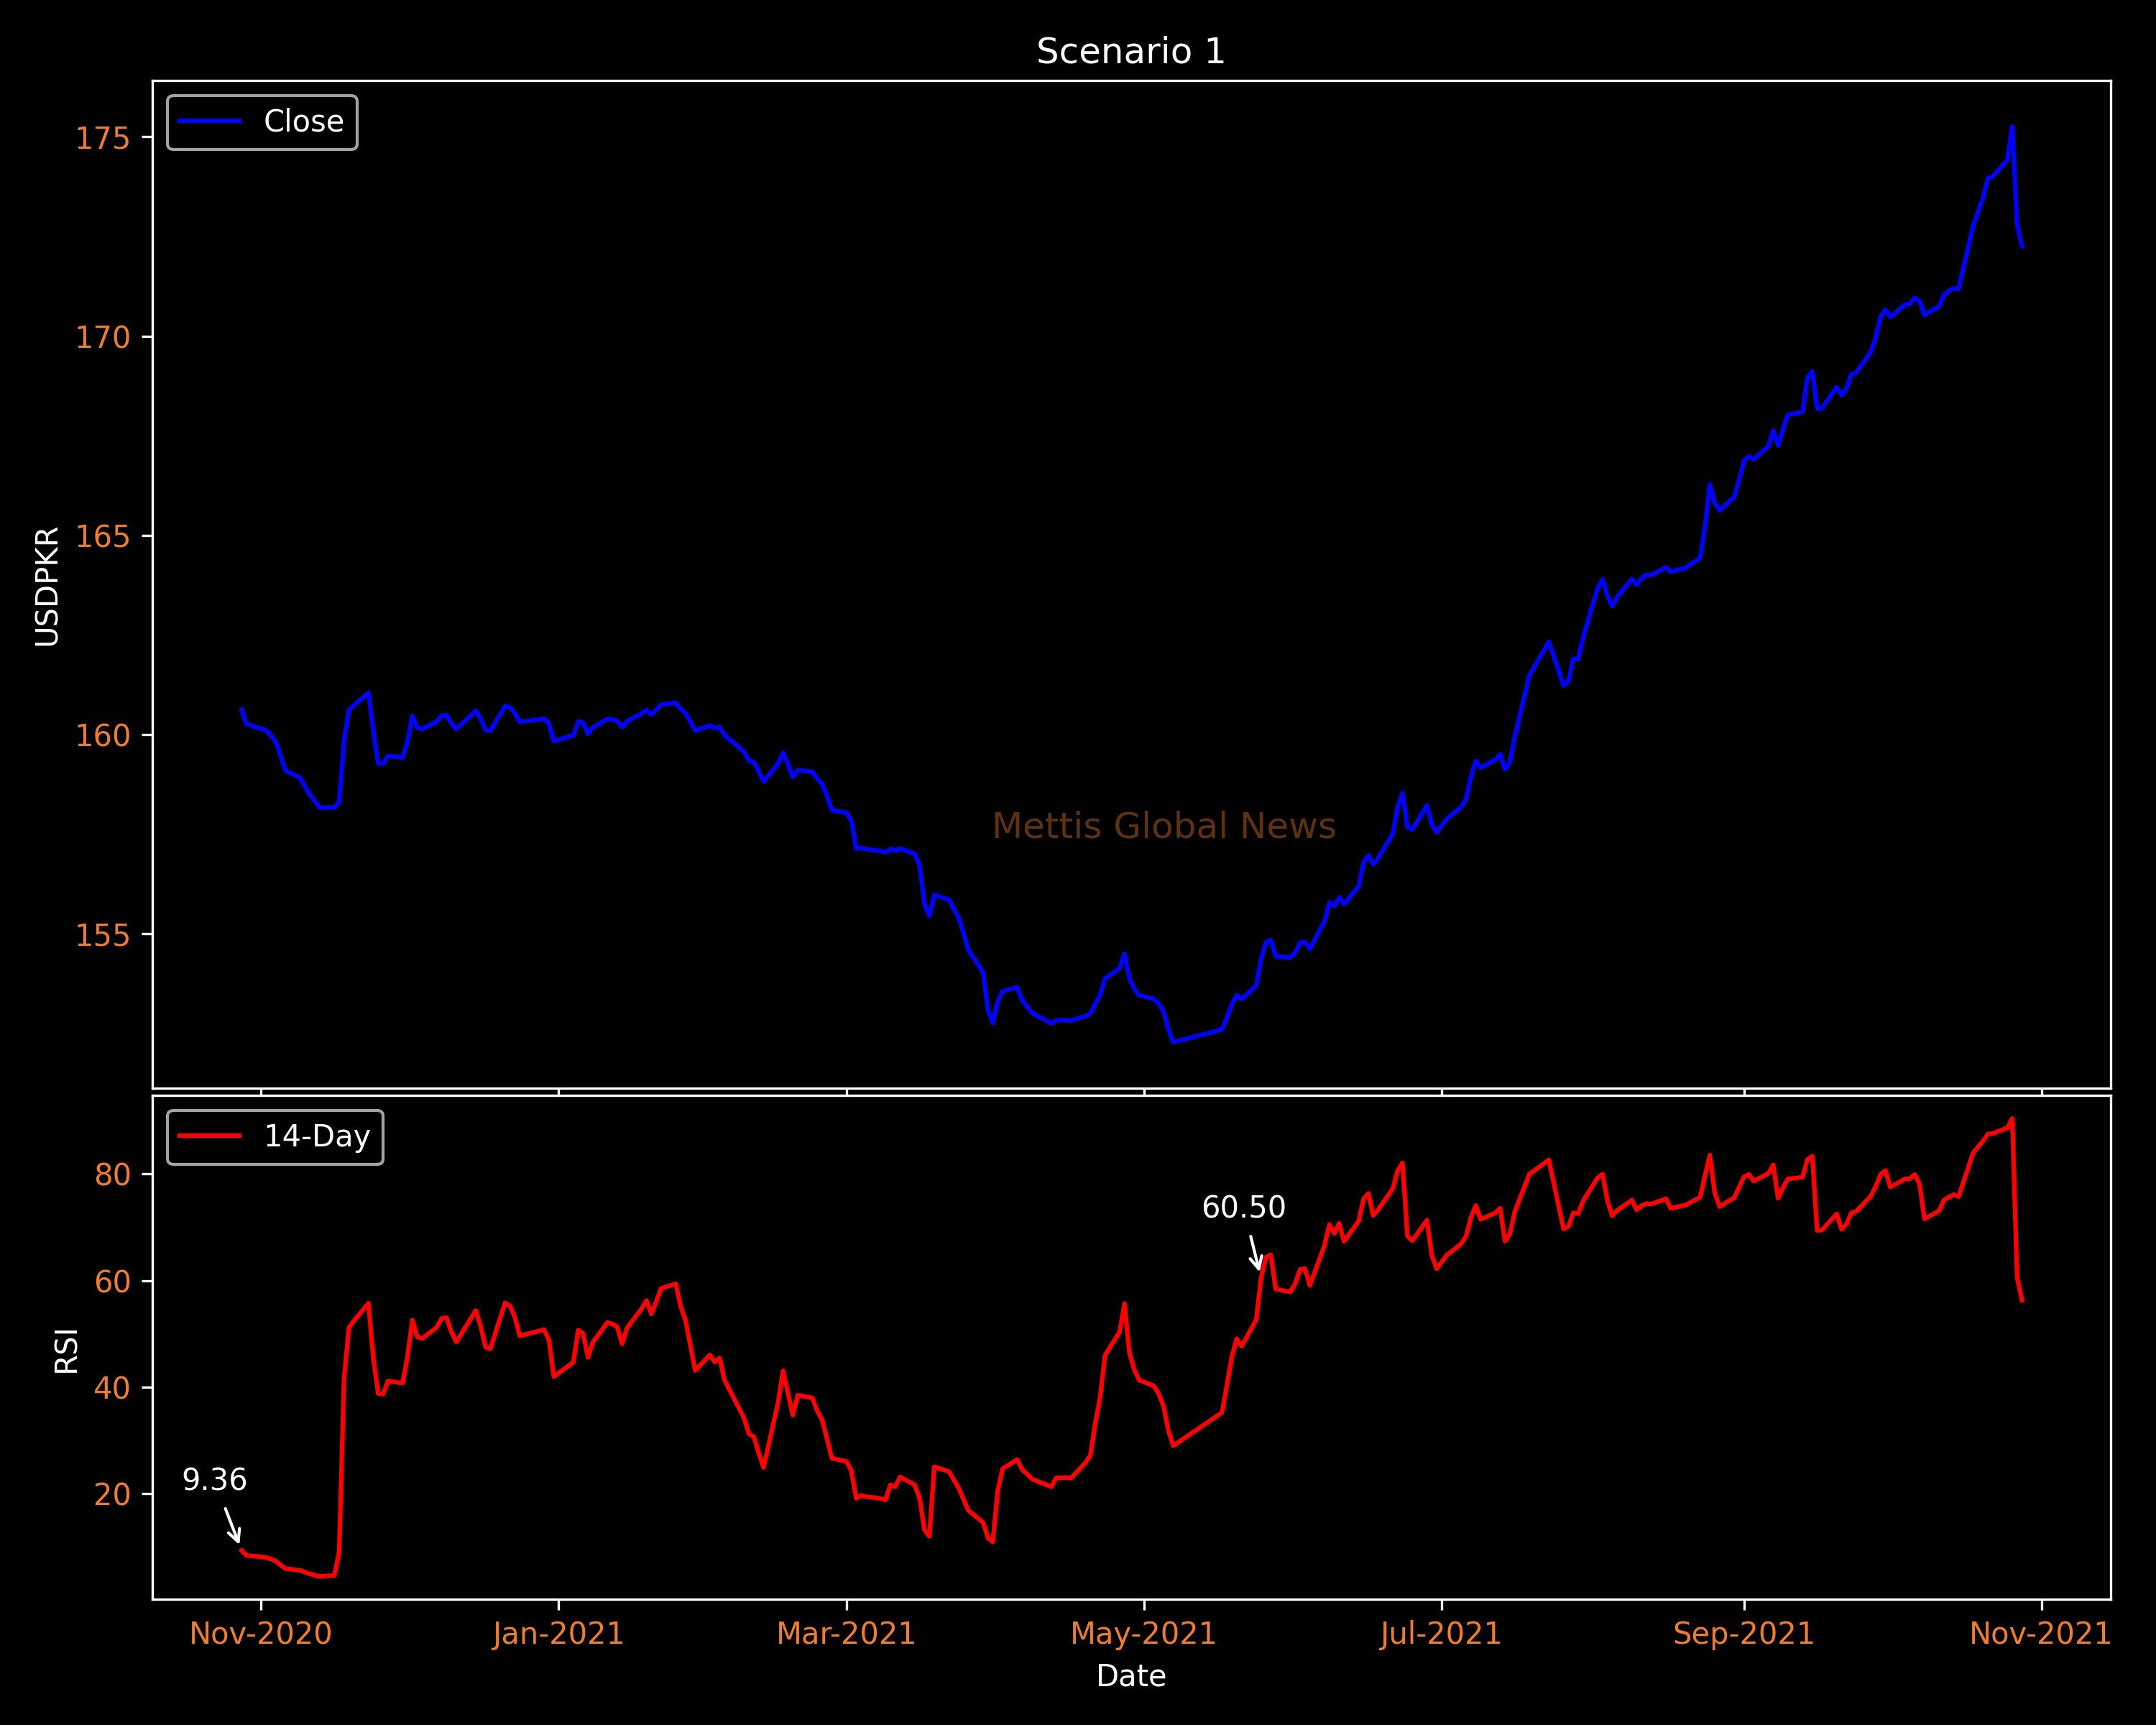
On October 28, 2020, the RSI fell below 10, while it reached its lowest point at 4.49 by November 13. But it was not until six months later on May 25, 2021 when the RSI reading crossed above 60.
The PKR then lost 7.16% against the USD in the next three months.
A similar pattern can be seen prior to that.
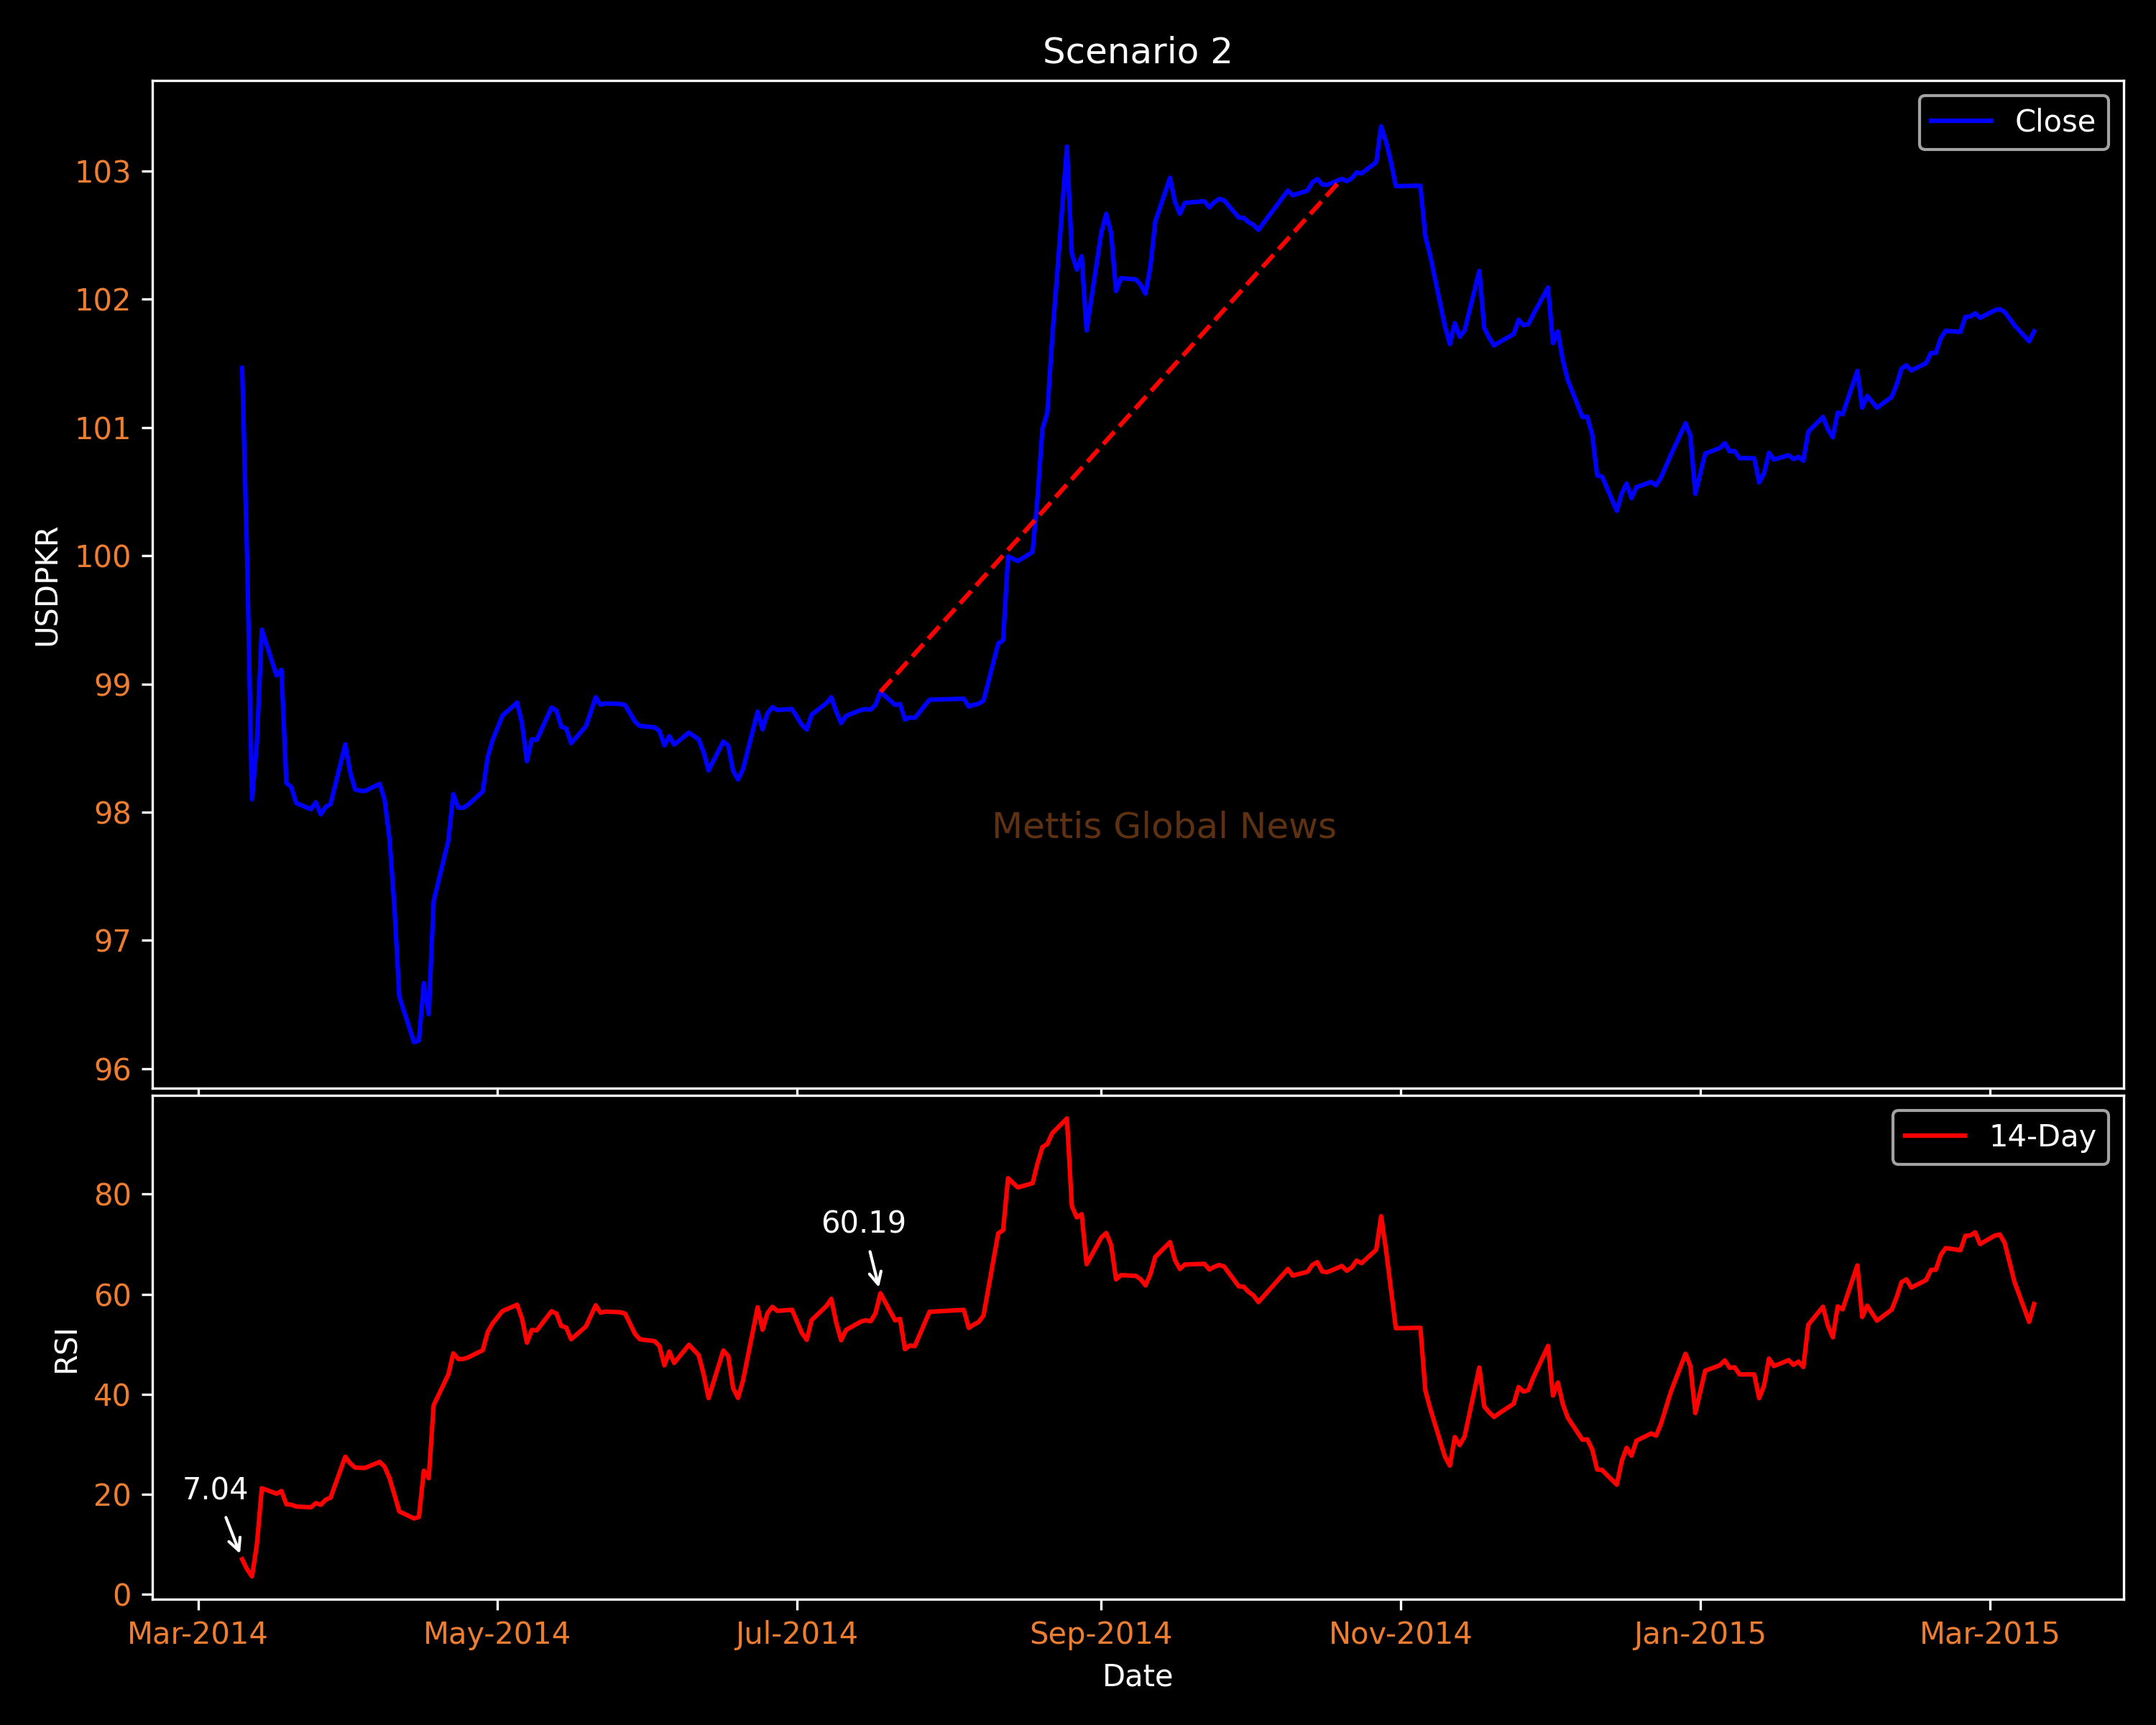
On March 10, 2014, the RSI fell below 10, while it hit its nadir at 3.61 by March 12.
After about four months, on July 18, 2014 the RSI reading crossed above 60 and the PKR lost 3.84% against the USD in the following three months.
The third case was a bit of an outlier, as on November 16, 2002, the RSI fell below 10, which was also the bottom for the RSI. But it was not until June 19, 2003 when the RSI reading crossed above 60 while the PKR remained almost unchanged in the next three months.
To note, the PKR/USD return from the moment when the RSI crosses 60 is used, as this signifies a break of resistance.
During a downtrend, the RSI tends to stay between the 10 to 60 range with the 50-60 zone acting as resistance.
It is worth noting that RSI on its own does not necessarily mean anything. It is just one indicator among many that can help investors gauge the market.
Disclaimer: The views and analysis in this article are the opinions of the author and are for informational purposes only. It is not intended to be financial or investment advice and should not be the basis for making financial decisions.
Copyright Mettis Link News
Related News


| Name | Price/Vol | %Chg/NChg |
|---|---|---|
| KSE100 | 171,021.20 228.53M | -0.42% -718.25 |
| ALLSHR | 103,836.39 572.65M | -0.41% -422.85 |
| KSE30 | 50,951.99 89.47M | -0.52% -264.77 |
| KMI30 | 240,633.87 93.99M | -0.31% -756.80 |
| KMIALLSHR | 66,572.75 300.61M | -0.28% -185.59 |
| BKTi | 48,673.23 31.18M | -0.70% -343.86 |
| OGTi | 33,702.25 6.35M | -0.61% -205.57 |
| Symbol | Bid/Ask | High/Low |
|---|
| Name | Last | High/Low | Chg/%Chg |
|---|---|---|---|
| BITCOIN FUTURES | 65,390.00 | 65,570.00 63,875.00 | 1175.00 1.83% |
| BRENT CRUDE | 92.03 | 93.60 89.58 | -4.75 -4.91% |
| RICHARDS BAY COAL MONTHLY | 105.75 | 0.00 0.00 | -1.55 -1.44% |
| ROTTERDAM COAL MONTHLY | 121.10 | 0.00 0.00 | 0.85 0.71% |
| USD RBD PALM OLEIN | 1,175.00 | 1,175.00 1,175.00 | 0.00 0.00% |
| CRUDE OIL - WTI | 84.78 | 86.20 83.10 | -4.53 -5.07% |
| SUGAR #11 WORLD | 14.76 | 14.79 14.54 | 0.07 0.48% |
Chart of the Day
Latest News
Top 5 things to watch in this week
Pakistan Stock Movers
| Name | Last | Chg/%Chg |
|---|
| Name | Last | Chg/%Chg |
|---|