Trade deficit improves by 34% YoY in 1HFY24

MG News | January 02, 2024 at 01:03 PM GMT+05:00

January 02, 2024 (MLN): Pakistan's trade deficit for the first half of FY24 improved significantly by 34.29% YoY to $11.15 billion as compared to $16.97bn in 1HFY23, according to data released by the Pakistan Bureau of Statistics (PBS).
During 1HFY24, exports rose by 5.17% YoY to Rs14.98bn, while imports fell by 16.28% YoY to stand at Rs26.13bn.
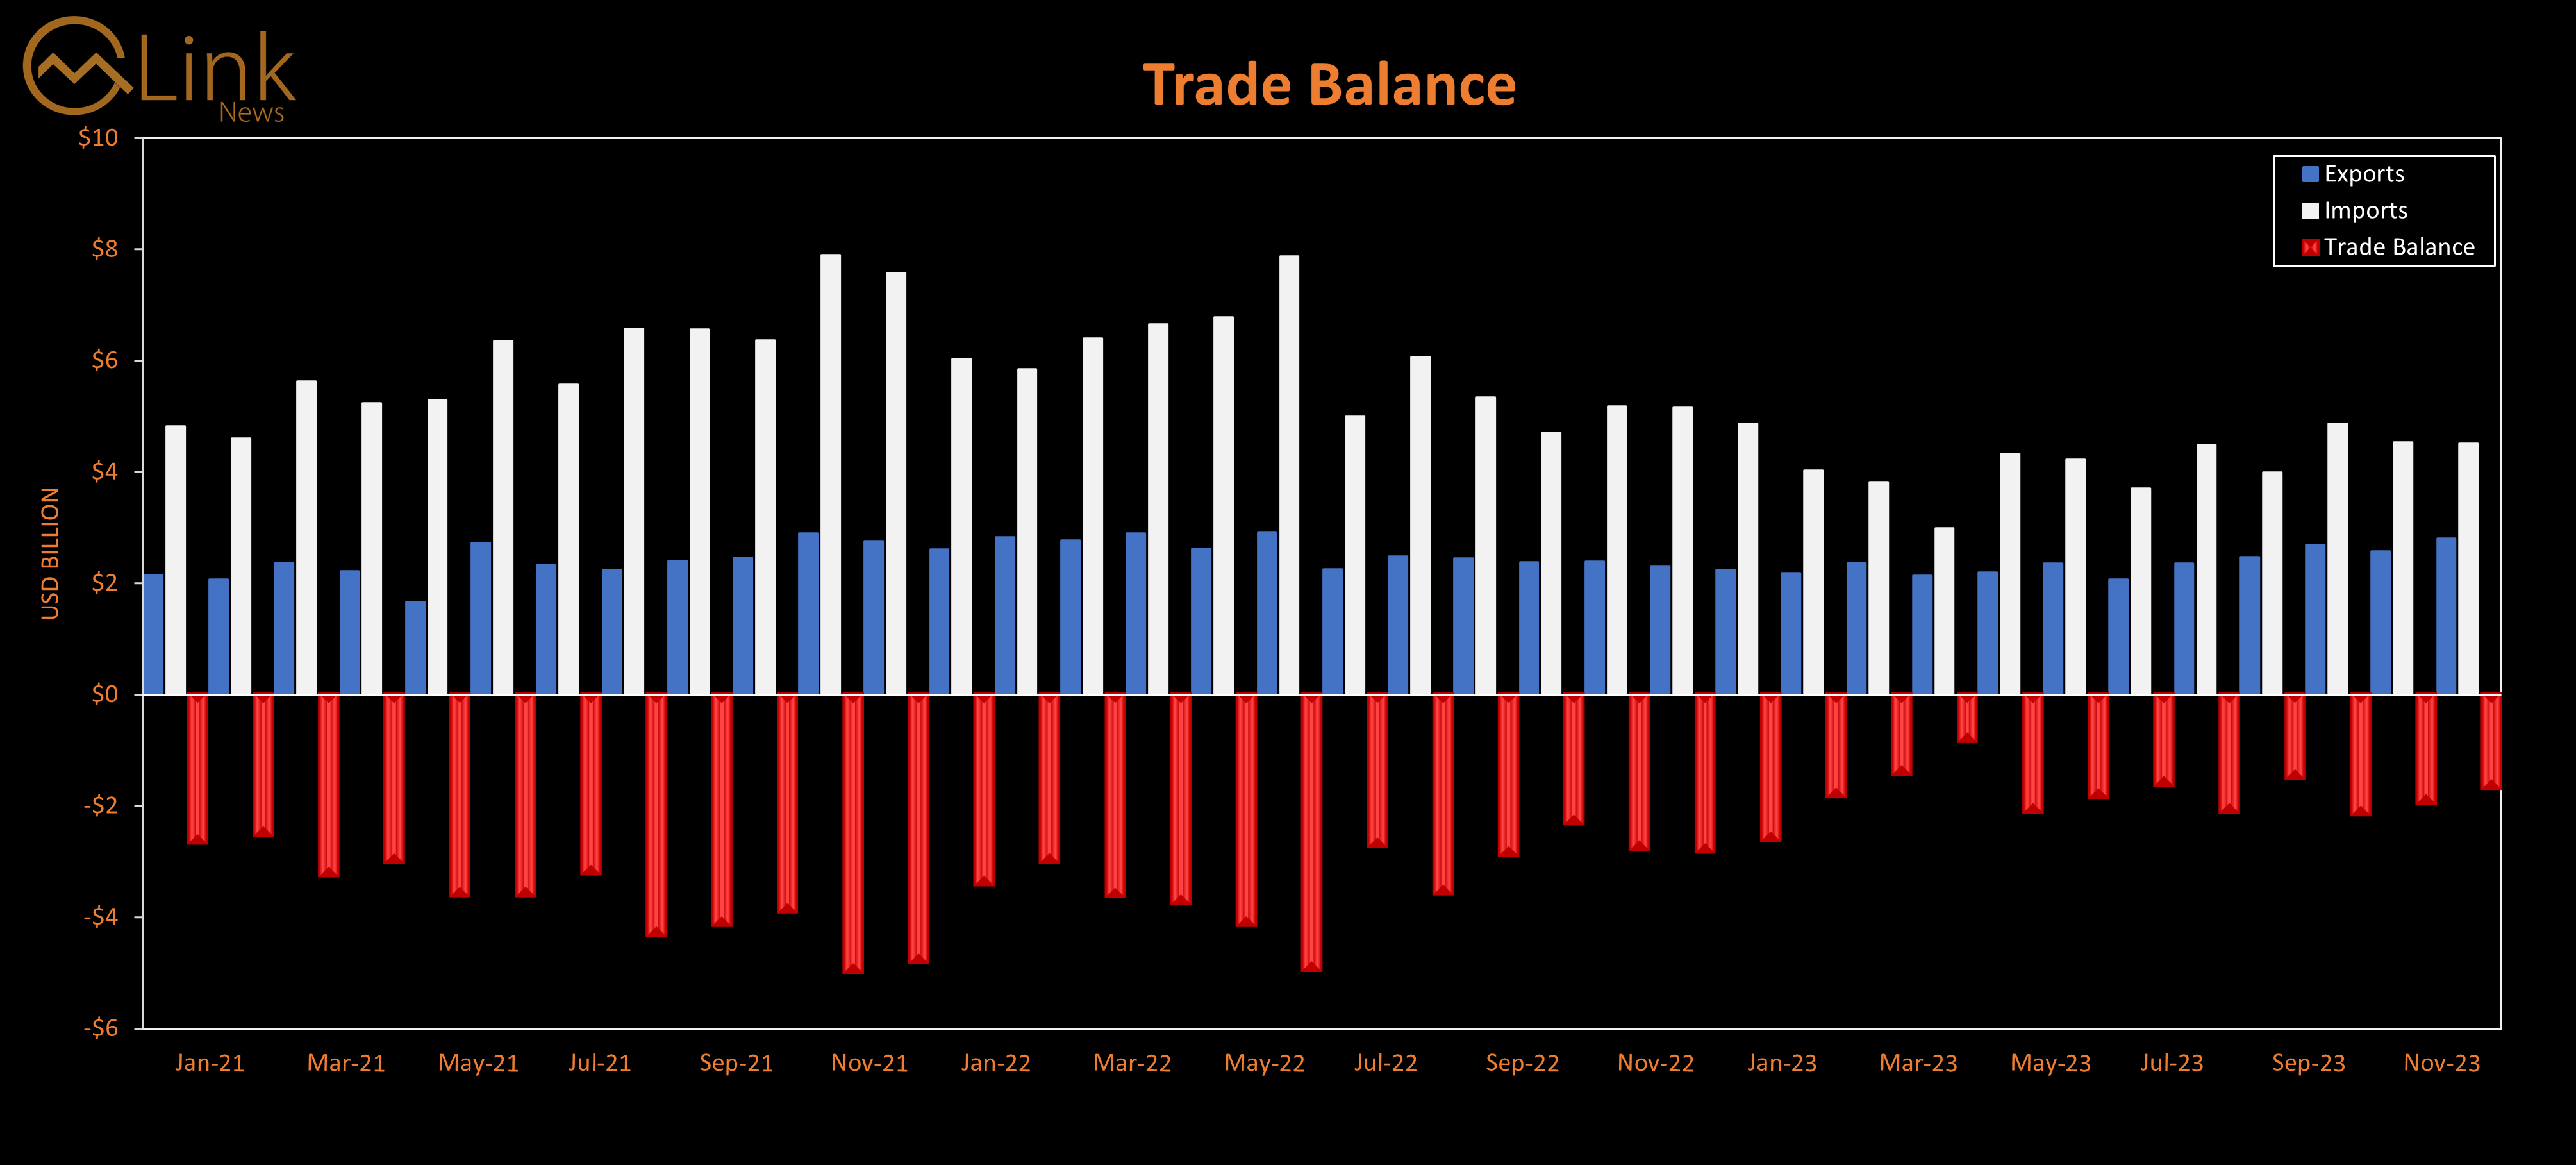
While in the month of December alone, the trade deficit stood at $1.7bn compared to a deficit of $1.97bn from the previous month, reflecting an improvement of 13.43% MoM.
The trade deficit compared to December 2022's deficit reduced by 40.13% as it stood at $2.84bn.
Exports in December increased by 9.29% MoM to $2.81bn compared to $2.57bn in November 2023.
Similarly, compared to December 2022, exports increased by 22.2% YoY.
The country's expenditure on imports during the review month inched down by 0.55% MoM, clocking in at $4.51bn compared to $4.54bn in the previous month.
Similarly, compared to December 2022, imports declined by 12.25% YoY as it stood at $5.14bn.
| Dec-23 | Nov-23 | Oct-23 | Sep-23 | Aug-23 | Jul-23 | Jun-23 | |
|---|---|---|---|---|---|---|---|
| USD Million | |||||||
| Exports | 2,812 | 2,572 | 2,690 | 2,476 | 2,366 | 2,068 | 2,356 |
| Imports | 4,514 | 4,539 | 4,864 | 3,994 | 4,528 | 3,705 | 4,219 |
| Trade Deficit | -1,702 | -1,966 | -2,174 | -1,518 | -2,162 | -1,637 | -1,863 |
| MoM % | |||||||
| Exports | 9.29% | -4.35% | 9.33% | 4.65% | 14.41% | -12.22% | 7.09% |
| Imports | -0.55% | -6.68% | 20.33% | -11.79% | 22.21% | -12.18% | -2.52% |
| Trade Deficit | -13.43% | -9.57% | 38.27% | -29.79% | 32.07% | -12.13% | -12.45% |
| YoY % | |||||||
| Exports | 22.21% | 7.66% | 13.55% | 1.23% | -4.67% | -8.25% | -19.26% |
| Imports | -12.25% | -13.47% | 4.91% | -25.30% | -25.42% | -25.80% | -46.46% |
| Trade Deficit | -40.13% | -31.72% | 4.46% | -47.67% | -39.76% | -40.23% | -62.45% |
Copyright Mettis Link News
Related News


| Name | Price/Vol | %Chg/NChg |
|---|---|---|
| KSE100 | 175,285.78 248.39M | 1.02% 1766.97 |
| ALLSHR | 106,536.82 578.97M | 1.02% 1073.42 |
| KSE30 | 52,320.98 90.24M | 1.18% 611.36 |
| KMI30 | 246,775.63 72.73M | 0.99% 2407.71 |
| KMIALLSHR | 68,372.65 345.21M | 0.84% 569.39 |
| BKTi | 49,718.24 37.75M | 1.43% 700.72 |
| OGTi | 35,126.27 7.30M | 0.44% 154.29 |
| Symbol | Bid/Ask | High/Low |
|---|
| Name | Last | High/Low | Chg/%Chg |
|---|---|---|---|
| BITCOIN FUTURES | 65,160.00 | 65,740.00 64,585.00 | 445.00 0.69% |
| BRENT CRUDE | 85.96 | 86.55 83.32 | 1.23 1.45% |
| RICHARDS BAY COAL MONTHLY | 105.75 | 0.00 0.00 | -1.25 -1.17% |
| ROTTERDAM COAL MONTHLY | 120.00 | 120.00 120.00 | 0.65 0.54% |
| USD RBD PALM OLEIN | 1,135.00 | 1,135.00 1,135.00 | 0.00 0.00% |
| CRUDE OIL - WTI | 80.46 | 80.93 78.19 | 1.12 1.41% |
| SUGAR #11 WORLD | 14.86 | 14.99 14.71 | -0.02 -0.13% |
Chart of the Day
Latest News
Top 5 things to watch in this week
Pakistan Stock Movers
| Name | Last | Chg/%Chg |
|---|
| Name | Last | Chg/%Chg |
|---|