
Textile exports edge lower to $1.41bn in August 2024

MG News | September 18, 2024 at 04:15 PM GMT+05:00

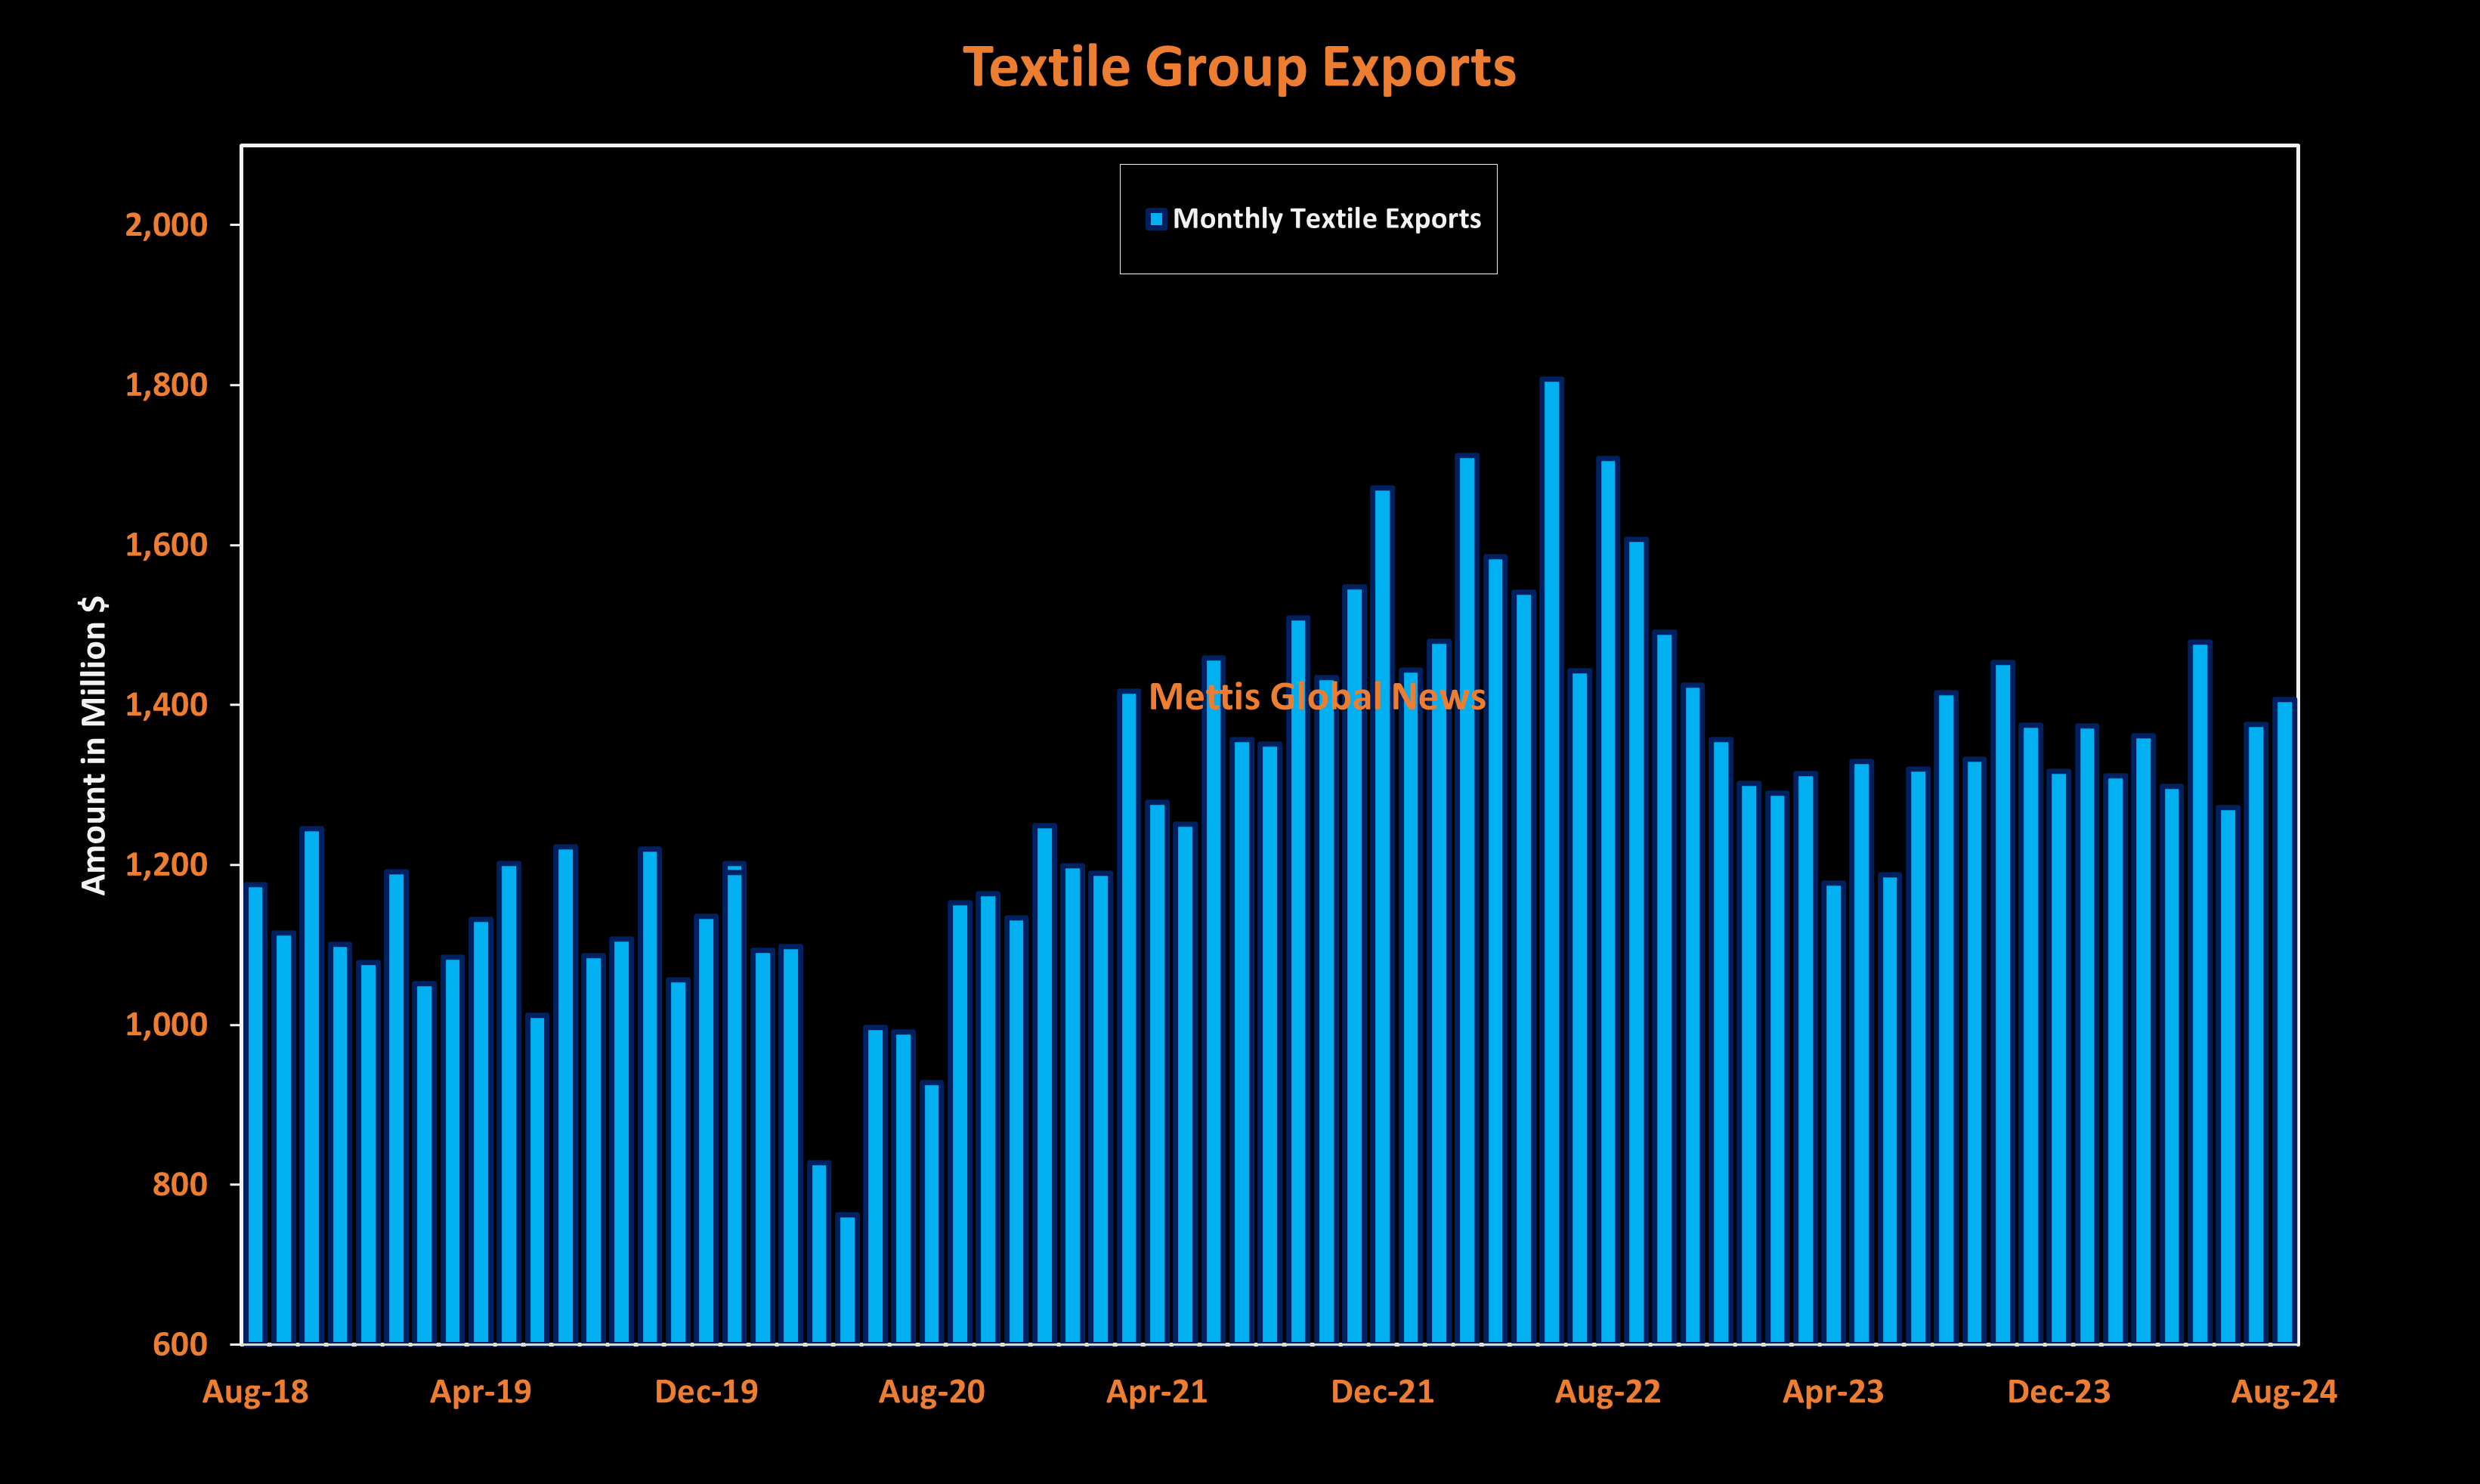
September 18, 2024 (MLN): The country's total textile exports dropped by a meager 0.57% to $1.41 billion in August 2024 compared to $1.42bn in August 2023, data released by the State Bank of Pakistan (SBP) showed.
Conversely, on a month-on-month basis, the exports of the same group registered an increase of 2.25% compared to exports worth $1.38bn in July 2024.
Cumulatively in 2MFY25, the textile exports increased by 1.75% to $2.78bn compared to $2.74bn in 2MFY24.
The total exports as per BOP for August clocked in at $2.49bn, up by 2.9% compared to $2.42bn in August 2023.
Likewise, on a monthly basis, exports grew by 4.8% MoM.
In August 2024, Textile Group products remained the major exportable goods for Pakistan as this group accounted for 56.56% of the total exports.
During the review month, key contributing products under the textile head were Knitwear ($378.83m), Readymade Garments ($326.97m), and Bed Wear ($236.3m).
Knitwear exports rose by 0.82%, Readymade Garments exports increased by 12.33%, and the inflow of foreign currency through Bed Wear moved up by 1.13%.
The food group remained the second most contributing group in total exports. The export value of this group stood at $492.05m, showing a significant growth of 25.5% YoY compared to $392.07m in August 2023.
Conversely, on a monthly basis, the exports from the respective group fell by 9.72% MoM compared to $545.01m in July 2024.
Collectively in 2MFY25, the earnings from food group exports rose by 35.45% YoY to $1.04bn compared to $765.62m in 2MFY24.
Under the same group, Rice remained the major source of foreign exchange earnings as the export value of the commodity during August 2024 stood at $205.11m marking a drop of 11.16% MoM, while rising 63.78% YoY.
The export of Oil Seeds, Nuts and Kernels stood at $14.68m in August, declining by 46.3% but increasing 52.93% compared to $27.33m in August 2023 and $9.6m in July 2024 respectively.
Going forward, the exports of surgical goods & medical instruments grew by 6.49% YoY to clock in at $38.56m.
The exports of leather manufacturers saw a negative trend as they declined by 1.43% YoY to $52.15m in August 2024.
Conversely, sports goods foreign earnings increased by 7.63% YoY to $32.4m in August 2024.
However, when compared with the figure of $36.88m in July 2024, the export of sports goods decreased by 12.14% MoM.
Inflow through the chemical and pharmaceutical products rose by 16.9% to $142.32m in August 2024 compared to $121.75m in SPLY.
The data further shows that the share of the Petroleum group in the country’s total export basket was only 1.71% in August 2024.
During the review period, the country earned $42.53m from exports of petroleum products, increasing by 44.43% YoY.
Copyright Mettis Link News
Related News

.png?width=280&height=140&format=Webp)

| Name | Price/Vol | %Chg/NChg |
|---|---|---|
| KSE100 | 177,166.52 410.56M | 0.33% 574.76 |
| ALLSHR | 107,641.65 676.88M | 0.48% 519.21 |
| KSE30 | 52,670.80 88.28M | 0.39% 203.40 |
| KMI30 | 251,460.53 103.06M | 0.76% 1891.30 |
| KMIALLSHR | 69,413.38 509.62M | 0.79% 544.65 |
| BKTi | 49,984.79 26.85M | -0.30% -151.57 |
| OGTi | 36,423.05 16.04M | 1.47% 527.97 |
| Symbol | Bid/Ask | High/Low |
|---|
| Name | Last | High/Low | Chg/%Chg |
|---|---|---|---|
| BITCOIN FUTURES | 77,540.00 | 78,915.00 76,745.00 | 360.00 0.47% |
| BRENT CRUDE | 93.60 | 94.83 92.74 | -0.18 -0.19% |
| RICHARDS BAY COAL MONTHLY | 110.30 | 110.50 110.30 | 0.05 0.05% |
| ROTTERDAM COAL MONTHLY | 125.25 | 125.25 125.25 | 1.50 1.21% |
| USD RBD PALM OLEIN | 1,175.00 | 1,175.00 1,175.00 | 0.00 0.00% |
| CRUDE OIL - WTI | 86.64 | 87.51 85.80 | -0.19 -0.22% |
| SUGAR #11 WORLD | 17.60 | 17.89 17.16 | 0.08 0.46% |
Chart of the Day
Latest News
Top 5 things to watch in this week
 Large Scale Manufacturing (LSM)
Pakistan Stock Movers
| Name | Last | Chg/%Chg |
|---|
| Name | Last | Chg/%Chg |
|---|