Tech Beat: PSO, HCAR, OGDC to be monitored

Abdur Rahman | August 13, 2023 at 09:35 AM GMT+05:00
August 13, 2023 (MLN): The following is an outlook for the KSE-100 index and some strong scrips based on technical analysis (historical quantitative data).
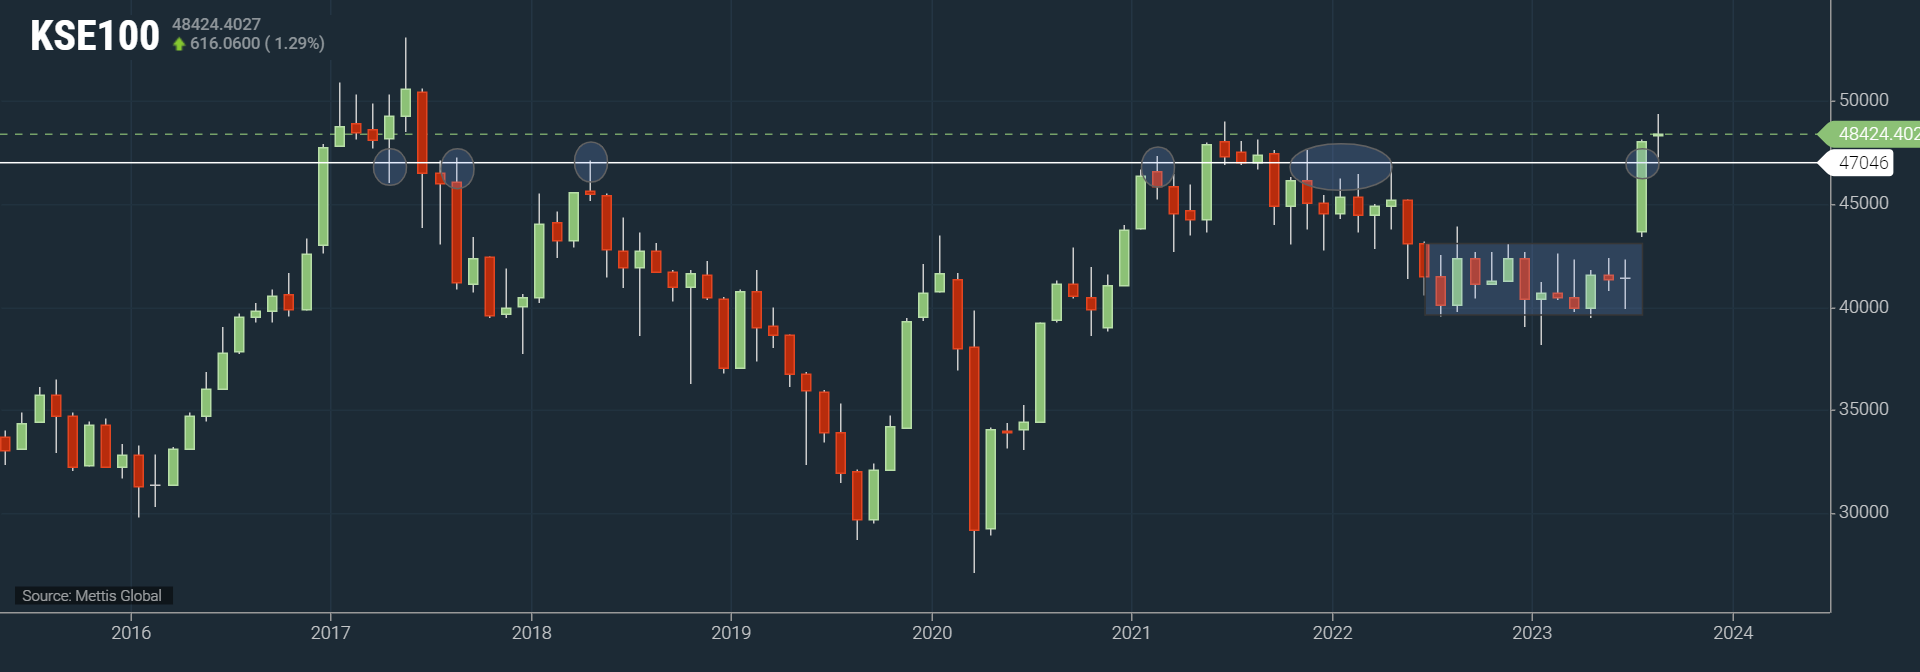
KSE-100 Monthly time-frame chart
| Support Levels | ||
|---|---|---|
| 47,000 | 46,000 | 43,500 |
| S1 | S2 | S3 |
| Resistance Levels | ||
|---|---|---|
| 49,000 | 50,500 | 53,127 |
| R1 | R2 | R3 |
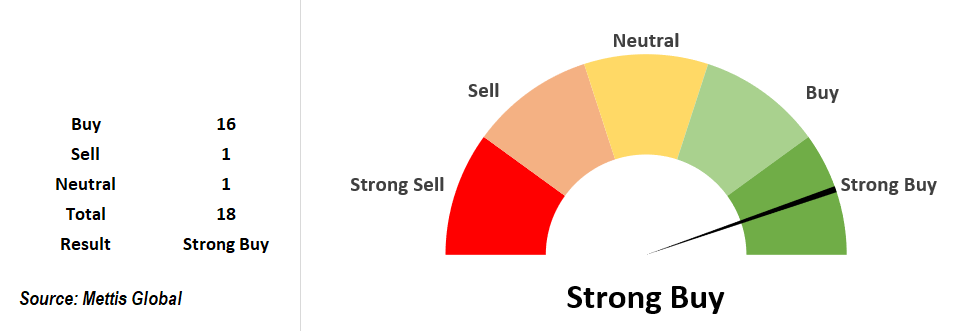
Recommendation Summary
From a technical standpoint, the buy stance from the last analysis still holds weight, but it's prudent to take a cautious approach, as the market navigates between potential corrections and the prevailing uptrend.
Based purely on technicals, the current stance is " Strong buy".
Strong Scrips to Monitor
| Ticker | Close Price | Resistance zone | Upside target | Short-term trend | Longterm trend | MA Stance | Oscillator Stance | |
| Short-term | Long-term | |||||||
| PSO | 124.85 | 126 | 154 | 200 | Down | Down | Sell | Neutral |
| HCAR | 123.74 | 129 | 136 (Achieved) | 165 | Down | Down | Sell | Neutral |
| OGDC | 103.47 | 109.6 | 99 (Achieved) | 125 | Neutral | Down | Buy | Neutral |
Price per share (Rs)
PSO
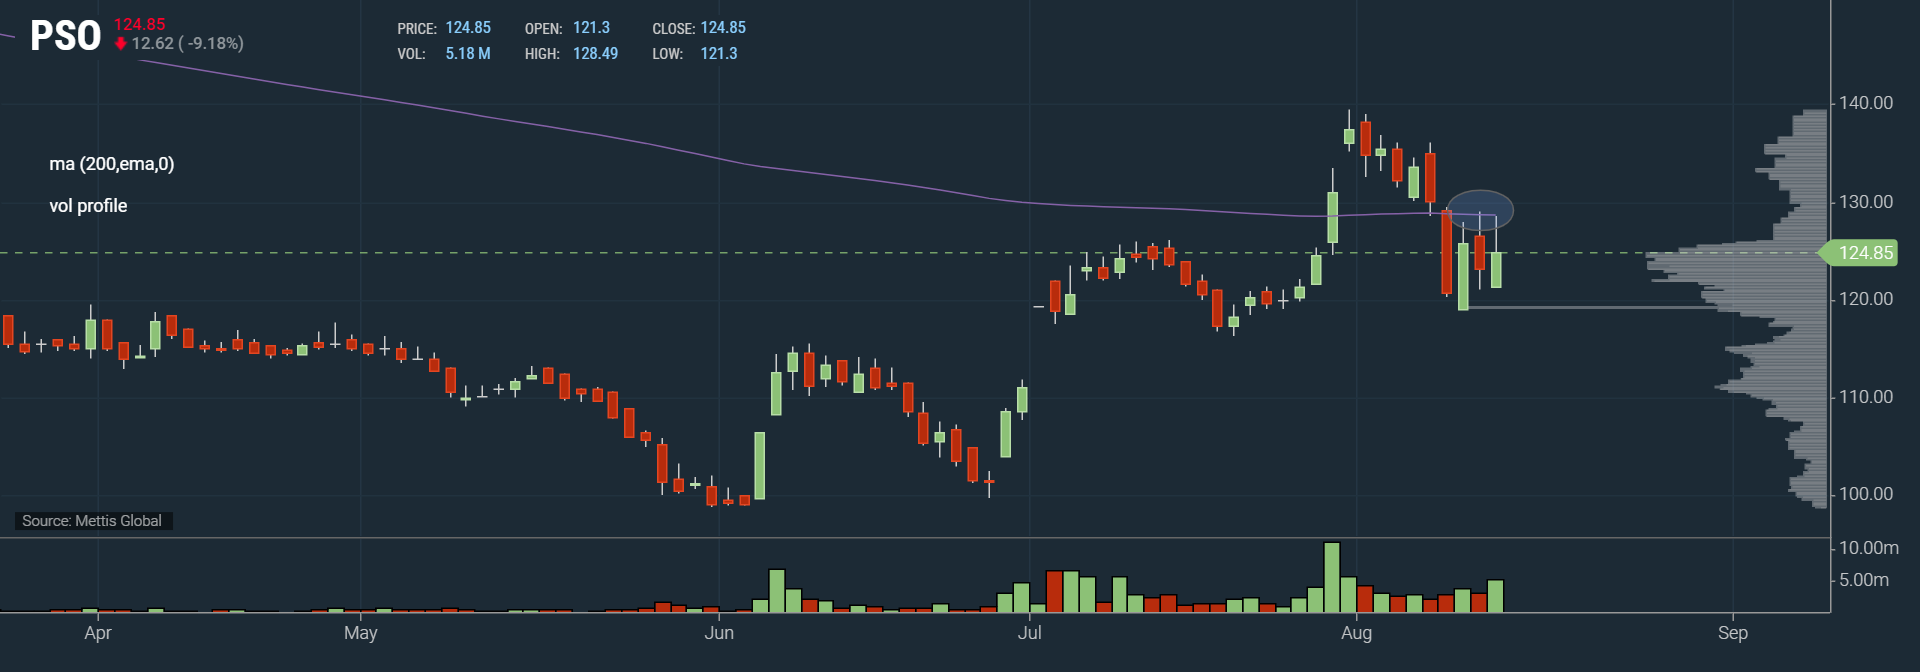
Daily time-frame chart
PSO broke out of its range, as well as above its 1D 200EMA. It was a suggested stock to monitor during the correction, which subsequently occurred.
However, it was unable to hold the 1D 200EMA and fell below it. Furthermore, it also retested this level from below to confirm the break.
It is advisable to consider new positions only on a break back above this level.
HCAR
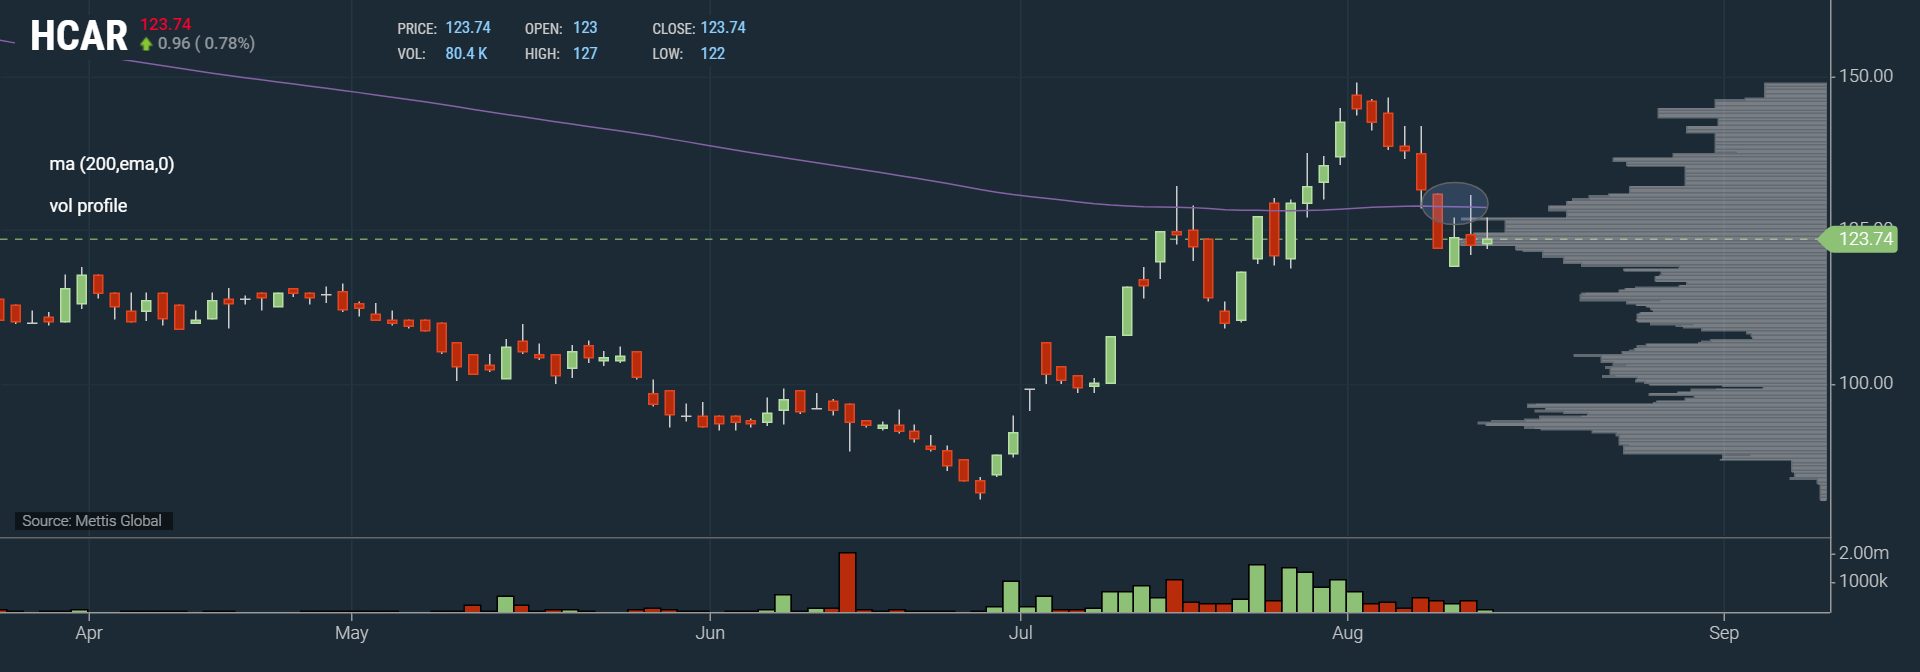
Daily time-frame chart
HCAR was also a recommended stock to monitor during the correction, which subsequently occurred, as it broke out above 1D 200EMA level for the first time since September of 2021.
However, it was also unable to hold the 1D 200EMA and fell below it. Furthermore, it also retested this level from below to confirm the break.
The level to watch remains the same, i.e., Rs129, as mentioned last time. The only difference now is to watch for a break above this level instead of a fall towards this level.
Everything else remains the same, with the short-term target already achieved and the long-term target in case of a flip of this level towards the HVN, which is around Rs175.
OGDC
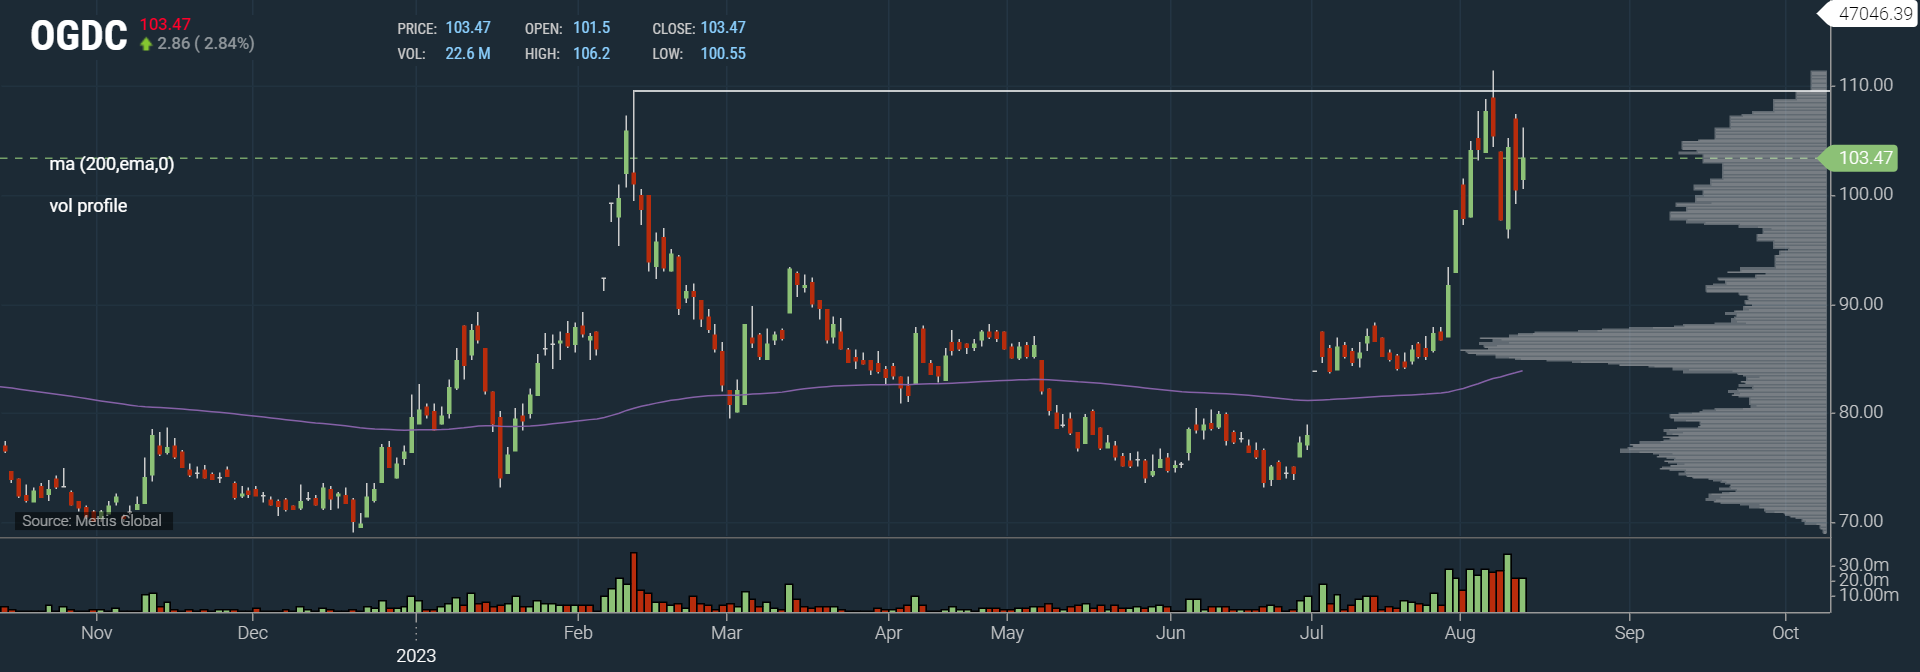
Daily time-frame chart
OGDC successfully achieved the target of Rs100. Currently, it stands around HVN and has also taken the high of February 2023.
This situation appears to resemble a distribution at the top. It is not recommended to buy unless there is a break above this area with acceptance.
Furthermore, on August 04, we observed high volume without a breakthrough above the key level. This occurred alongside a relatively small change, commonly referred to as a "churn bar" in technical terms.
Essentially, this signifies high volume but inside small body candles, and signals the start/end of moves.
Others
MCB was also a recommended stock to buy around the support zone of Rs130-137, which it reached and bounced off from towards the high Rs140s area. It closed the week at Rs145.75, averaging a 9% gain. Going forward, Rs153.5 is the key level to watch out for.
On the flip side, WTL was a disappointing call with a buy zone of Rs1.29 and a closing price of Rs1.2, resulting in an approximate -7% decline.
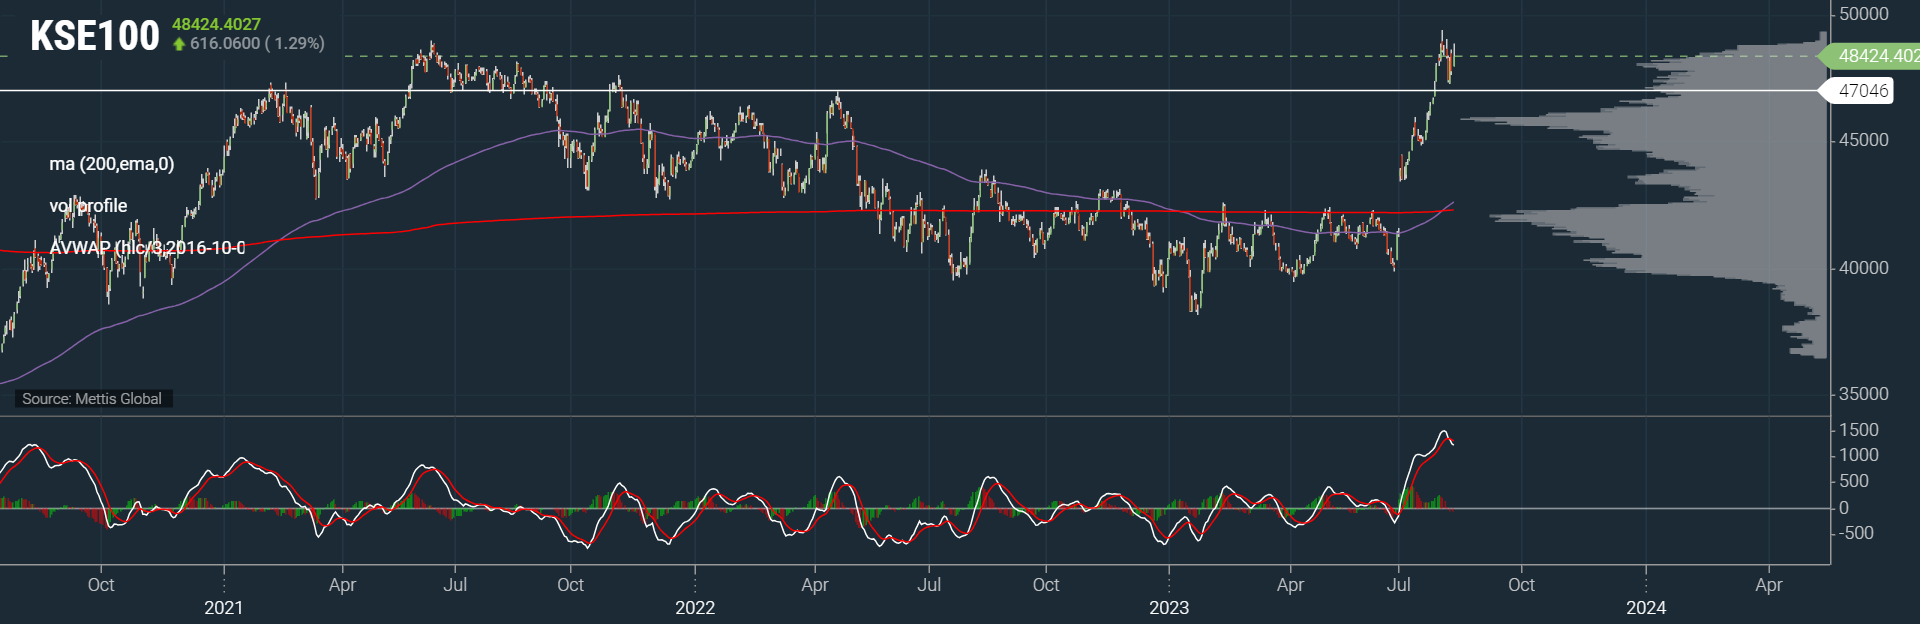
KSE-100 Overview
The benchmark KSE-100 Index concluded Friday's trading session at 48,424 points, losing 161pts or 0.33% WoW.
As highlighted two weeks ago, the 47,000 points level holds significant historical importance, evident from the chart above. The KSE-100 breached this level effortlessly, portraying the strength and current state of the market.
After making a high of 49,400, KSE-100 retraced to test this 47,000 level which has now proven to be a support level (forming a classic resistance-turned-support pattern). It promptly rebounded towards 48,000.
Going forward, the pivotal point is to overcome the 49,000 resistance, which will pave the way toward all-time highs.
On the flip side, it is very important to hold this 47,000 level. A breach below would initiate a sharp downward move towards 46,000, and a subsequent break of this could lead to the 43,500 level.
Nevertheless, even in this scenario, the overall uptrend would persist, surprising as it may sound.
Considering the present market state, it seems unlikely for the market to give these huge dips/buying opportunities.
The oscillators have already cooled off, with the RSI declining from 87 to 68, and the Stochastic RSI dropping from 98 to single digits.
KSE-100 Daily time-frame chart
Technical terms used:
Moving average (MA): A calculation that takes the arithmetic mean of a given set of prices over a specific number of days in the past.
Exponential moving average (EMA): A weighted average that gives greater importance to the price of a stock in more recent days, making it an indicator that is more responsive to new information.
Hull Moving Average (HMA): It measures the average price of an asset over a period of time.
Volume weighted average price (VWAP): It is just a moving average but puts Volume into the calculation.
Point of control (POC): It is the price level at which the greatest number of contracts are traded during a given trading period.
Relative strength index (RSI): It compares a security’s strength on days when prices go up to its strength on days when prices go down.
Moving Average Convergence Divergence: It is a trend-following momentum indicator that shows the relationship between two EMAs of a security's price. The MACD line is calculated by subtracting the 26-period EMA from the 12-period EMA.
High Volume Node (HVN): It refers to the price at which the largest amount of volume occurred.
Disclaimer: The opinions in this article are the author’s and do not necessarily represent the views of Mettis Link News (MLN). Nothing in this article should be considered the sole basis for making financial decisions.
Copyright Mettis Link News
Related News


| Name | Price/Vol | %Chg/NChg |
|---|---|---|
| KSE100 | 152,011.26 202.91M | -2.25% -3500.30 |
| ALLSHR | 90,933.96 349.11M | -1.93% -1787.62 |
| KSE30 | 45,975.85 87.34M | -2.50% -1180.47 |
| KMI30 | 220,290.57 84.33M | -2.27% -5117.55 |
| KMIALLSHR | 59,449.18 202.18M | -1.86% -1128.08 |
| BKTi | 42,093.29 29.70M | -2.76% -1193.09 |
| OGTi | 31,521.03 8.65M | -2.71% -879.26 |
| Symbol | Bid/Ask | High/Low |
|---|
| Name | Last | High/Low | Chg/%Chg |
|---|---|---|---|
| BITCOIN FUTURES | 67,120.00 | 68,875.00 65,850.00 | -1220.00 -1.79% |
| BRENT CRUDE | 108.99 | 109.74 99.08 | 7.83 7.74% |
| RICHARDS BAY COAL MONTHLY | 112.50 | 0.00 0.00 | 6.40 6.03% |
| ROTTERDAM COAL MONTHLY | 113.00 | 114.50 113.00 | -0.40 -0.35% |
| USD RBD PALM OLEIN | 1,175.00 | 1,175.00 1,175.00 | 0.00 0.00% |
| CRUDE OIL - WTI | 112.06 | 113.97 97.50 | 11.94 11.93% |
| SUGAR #11 WORLD | 14.96 | 15.50 14.91 | -0.33 -2.16% |
Chart of the Day
Latest News
Top 5 things to watch in this week
Pakistan Stock Movers
| Name | Last | Chg/%Chg |
|---|
| Name | Last | Chg/%Chg |
|---|