Tech Beat: KSE100 poised to test 47,000
Abdur Rahman | September 23, 2023 at 10:19 PM GMT+05:00
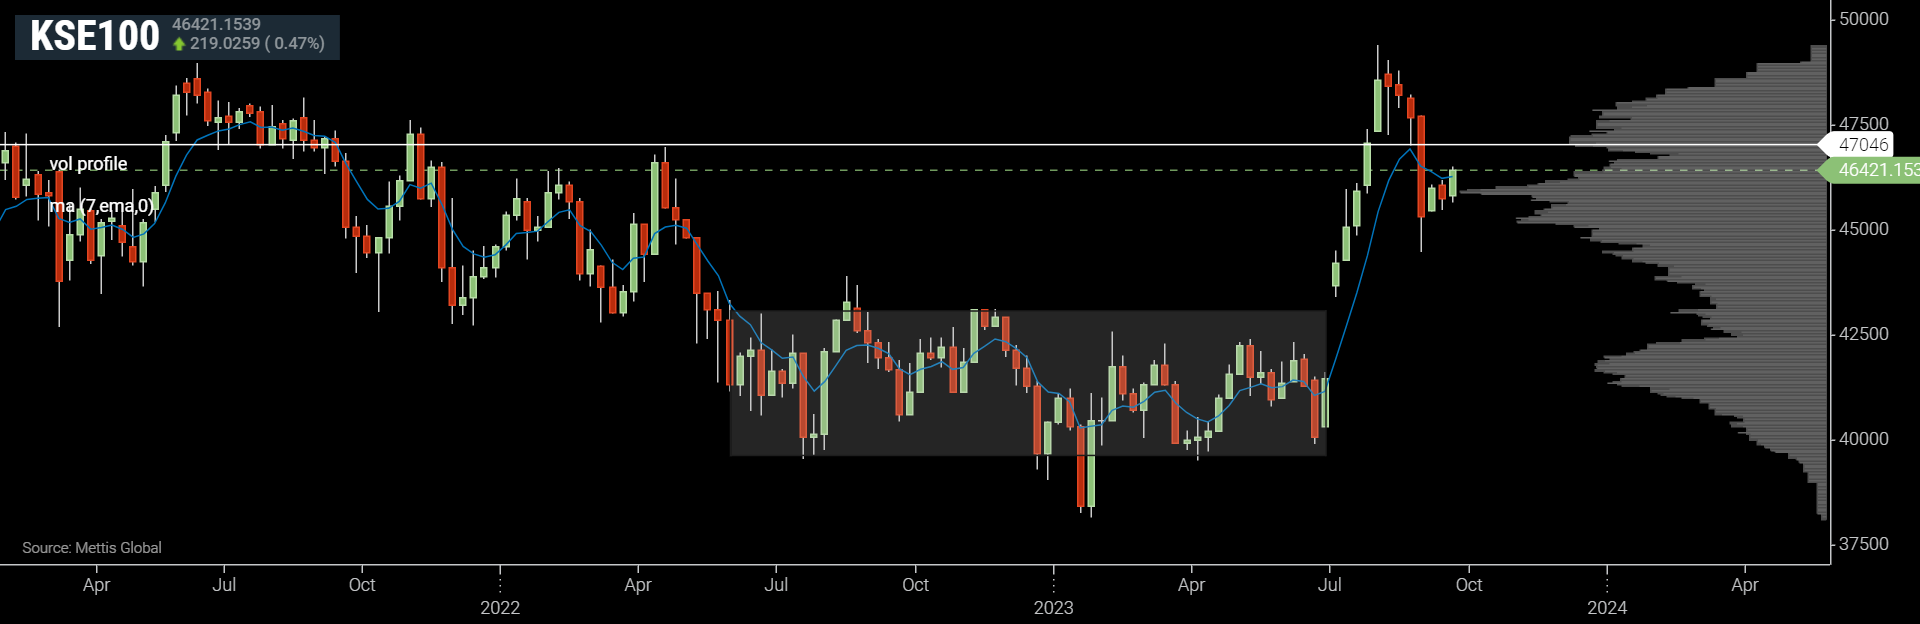
September 23, 2023 (MLN): The benchmark KSE-100 index is poised to test the 47,000-47,200 resistance level in the coming days as long as 46,000 holds.
KSE-100 Daily time-frame chart

| Support Levels | ||
|---|---|---|
| 46,000 | 45,550 | 44,500 |
| S1 | S2 | S3 |
| Resistance Levels | ||
|---|---|---|
| 47,000 | 47,500 | 49,404 |
| R1 | R2 | R3 |
Over the past two weeks, the KSE-100 Index had a tough time trying to break through the 46,000 level. It tested this level multiple times and faced rejection.
That is, until two days ago, on Thursday, when the index finally managed to push past 46,000. This breakthrough was driven by some positive newsflow, which boosted market confidence.
Moreover, the index was able to get a weekly close above this level.
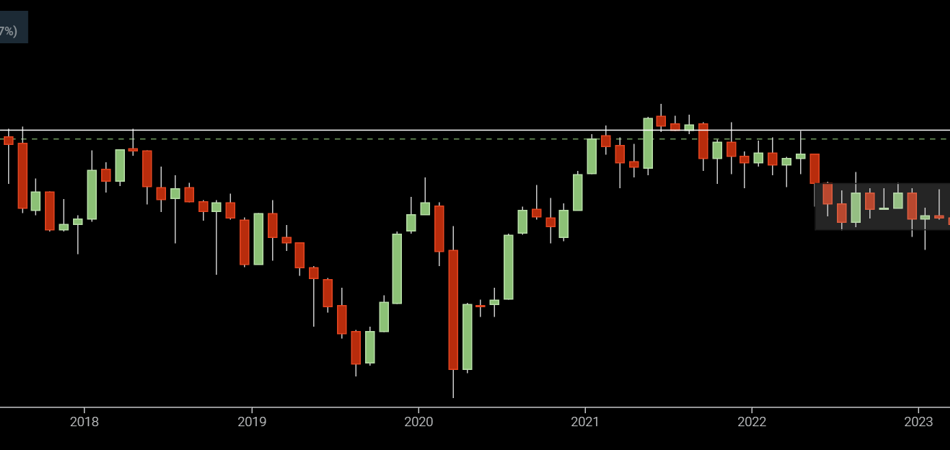
KSE-100 Weekly time-frame chart
As long as the 46,000 level holds, the path forward appears promising, with the market poised to test the next resistance which stands at 47,000.
The 46,000 level is a clear invalidation point for long positions across the board and a must-hold level for upside. Any dip below this level would confirm a potential fakeout or deviation, possibly triggering a drop toward the 44,500 mark, with the 43,500 level looming as the next support.
Some causes for concern
The market is likely to encounter significant resistance in the range of 47,000 to 47,200.
Furthermore, although the 44,500 level appeared as a solid bottom, coinciding with the 50% Fibonacci retracement level. However, there are some causes for concerns about the quality of this low's development, as it can not be categorized as an "excess," as described by Steidlmayer in his book "Trading with Market Profile".
The 44,500 bottom seems like a no excess with a poor low, no tails are noticed at the profile extremes (lack of excess). Such zones have a high probability of getting revisited.
Therefore it is important not to dismiss the possibility of another retest of these lows, and if this level is breached, it could pave the way for further declines, specifically toward the previously mentioned level of 43,500.
On the flip side, if the index manages to break and find acceptance above 47,000, it will open the way for new yearly highs.
Monitoring price movements and practicing risk management strategies should remain a top priority for market participants.
Technical terms used:
Excess: The concept of excess in the Market Profile is illustrated through the resemblance of market behavior to a normal distribution curve, mirroring how human behavior tends to follow statistical patterns.
This distribution also signifies the phenomenon of decreased participation as prices move to extremes, akin to bidders dropping out in an auction as prices rise or fall to extremes.
Disclaimer: The views and analysis in this article are the opinions of the author and are for informational purposes only. It is not intended to be financial or investment advice and should not be the basis for making financial decisions.
Copyright Mettis Link News
Related News


| Name | Price/Vol | %Chg/NChg |
|---|---|---|
| KSE100 | 162,994.17 366.14M | -1.71% -2829.70 |
| ALLSHR | 97,525.91 833.18M | -1.65% -1634.99 |
| KSE30 | 49,090.22 171.05M | -2.02% -1011.73 |
| KMI30 | 234,097.76 141.71M | -1.92% -4583.61 |
| KMIALLSHR | 63,284.58 381.76M | -1.79% -1151.00 |
| BKTi | 45,458.10 90.77M | -1.53% -707.82 |
| OGTi | 33,162.89 14.24M | -2.82% -962.44 |
| Symbol | Bid/Ask | High/Low |
|---|
| Name | Last | High/Low | Chg/%Chg |
|---|---|---|---|
| BITCOIN FUTURES | 78,725.00 | 79,420.00 76,515.00 | 1985.00 2.59% |
| BRENT CRUDE | 108.56 | 112.45 106.23 | -1.84 -1.67% |
| RICHARDS BAY COAL MONTHLY | 113.00 | 0.00 0.00 | 0.00 0.00% |
| ROTTERDAM COAL MONTHLY | 109.25 | 0.00 0.00 | -0.20 -0.18% |
| USD RBD PALM OLEIN | 1,191.50 | 1,191.50 1,191.50 | 0.00 0.00% |
| CRUDE OIL - WTI | 102.11 | 106.65 99.30 | -2.96 -2.82% |
| SUGAR #11 WORLD | 14.97 | 15.01 14.42 | 0.36 2.46% |
Chart of the Day
Latest News
Top 5 things to watch in this week
Pakistan Stock Movers
| Name | Last | Chg/%Chg |
|---|
| Name | Last | Chg/%Chg |
|---|