Tech Beat: Crude Oil's Path Amid Supply Worries, Rate Dynamics

Abdur Rahman | August 26, 2023 at 04:10 PM GMT+05:00

August 26, 2023 (MLN): Crude Oil's seven-week gains in prices cooled off briefly. Technical analysis indicates a potential reversal signaled by a doji candle at a key resistance and a small Head & Shoulders pattern.
West Texas Intermediate (WTI) Daily time-frame chart

| Support Levels | ||
|---|---|---|
| $78.15 | $75.10 | $72.75 |
| S1 | S2 | S3 |
| Resistance Levels | ||
|---|---|---|
| $80.13 | $83.23 | $84.89 |
| R1 | R2 | R3 |
Oil prices marked a remarkable streak of seven consecutive weeks of gains, primarily driven by increasing concerns of supply shortages in the coming months on top of rising tensions between Russia and Ukraine.
However, this robust upward trajectory experienced a slight cooling off during the last two weeks.
From a technical standpoint, the prior week's conclusion exhibited the formation of a doji candle (weekly time-frame) at a notably significant resistance level. This occurrence signified a distinct rejection and reversal from that point.
Furthermore, as can be seen from the chart below the emergence of a small Head & Shoulders pattern. This pattern could potentially signify a shift in market sentiment and warrant careful observation for potential implications on future price movements.
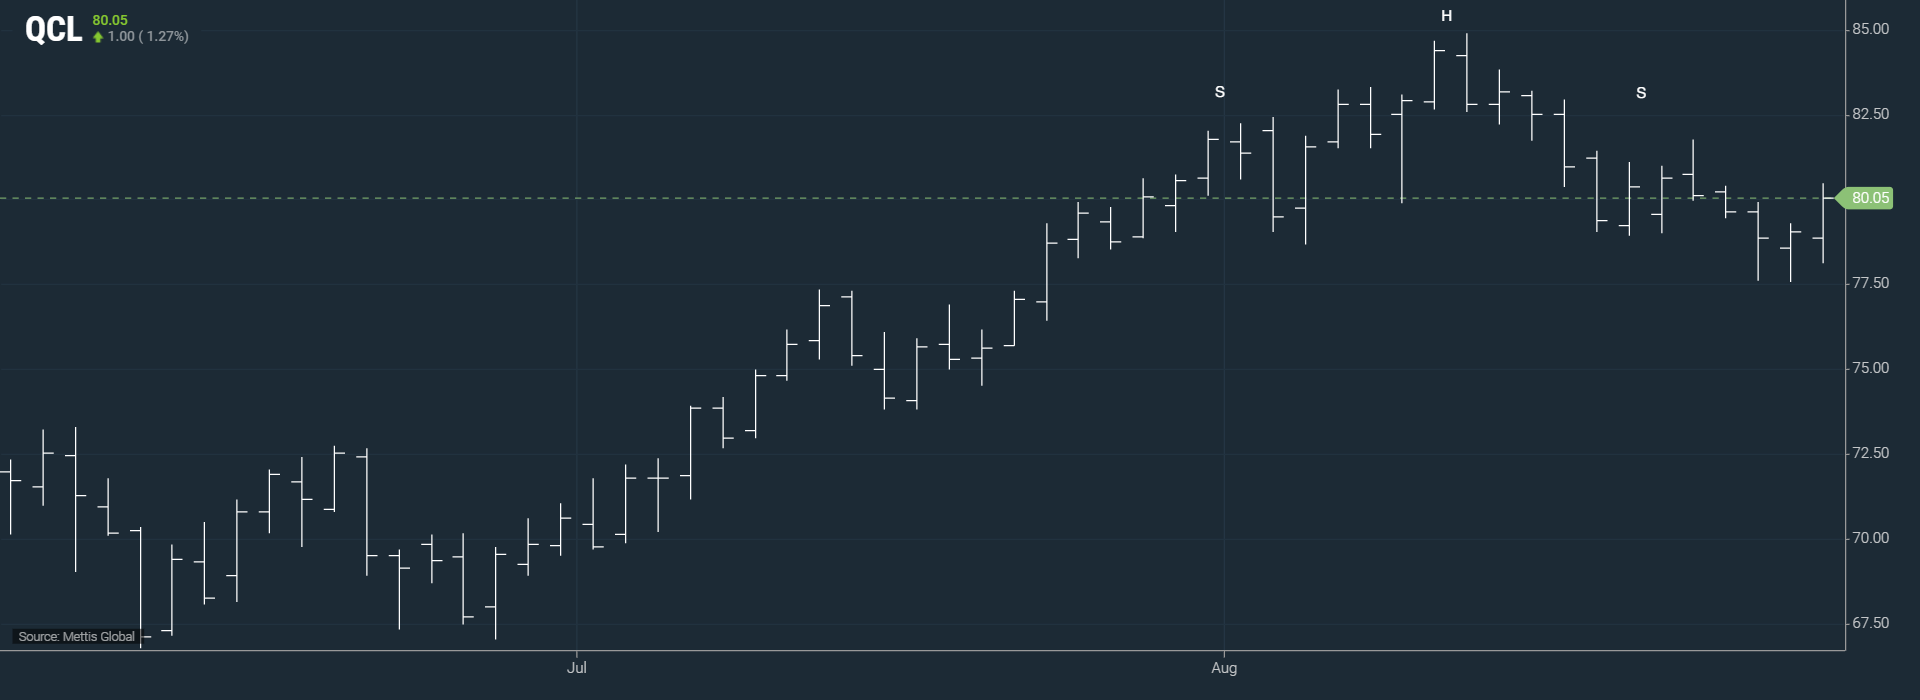
In the most recent assessment on July 17, the analysis pinpointed the position of crude oil futures just shy of the 1D 200EMA mark.
Subsequently, we saw it break this level, moreover, during the current week, specifically on Wednesday and Thursday, there were retests of this level.
Remarkably, each of these retests led to rebounds, showcasing the significance of this level.
The potential for a short-term uptrend hangs in the balance, subject to the upholding of this critical level. A breach below this will open the door for further losses.
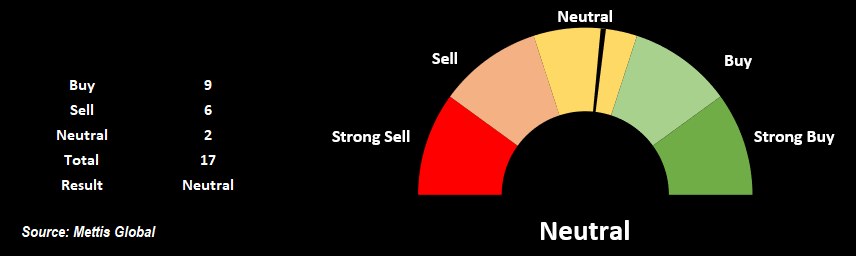
Technicals are giving a Neutral stance, and taking into account the below mentioned fundamentals, the potential outcome could sway in either direction.
To advance upwards, holding the 1D 200EMA is key. Conversely, if this level is breached, it could pave the way for potential downward risks.
Proactive Monetary Policy
Last night, Federal Reserve Chairman Jerome Powell delivered his speech at the Jackson Hole gathering, discussing the present economic landscape and the Federal Reserve's position.
He stressed the Fed's proactive stance in monetary policy, affirming their full readiness to implement further rate increases if the circumstances necessitate such action.
Regarding the possibility of future rate hikes, Powell indicated a prudent and careful approach. He underscored the importance of thoughtful deliberation before making any decisions regarding rate increases.
Powell acknowledged that an economy displaying growth beyond the established trend might warrant additional rate hikes.
Chairman Powell also restated that the Fed will uphold its 2% inflation target.
In addressing the matter of inflation, Chairman Powell brought attention to the potential need for more subdued labor markets to effectively lower inflation.
In the wake of the speech, markets are factoring in a greater likelihood of additional rate hikes. The CME Fed Watchtool now indicates odds of a 25 basis point rate hike in September have more than doubled to 20% after Powell's speech.
Additionally, the chances of another rate hike this year have just reached a 2-month high of 52.1%. Rate cuts are now not anticipated to begin until June 2024.
The Fed remains committed to achieving 2% inflation and is willing to take necessary measures to reach that goal.
Impact on Oil Prices
In this context, the likelihood of higher interest rates could lead to a situation where oil prices face a degree of pressure.
Since oil and interest rates tend to move in opposite directions, as unstable / higher interest rates discourage economic activity.
Such a scenario might place downward pressure on oil prices due to potential reductions in consumer spending and overall economic growth.
Technical terms used:
Head & Shoulders pattern: A head and shoulders pattern is used in technical analysis. It is a specific chart formation that predicts a bullish-to-bearish trend reversal.
Moving average (MA): A calculation that takes the arithmetic mean of a given set of prices over a specific number of days in the past.
Exponential moving average (EMA): A weighted average that gives greater importance to the price of a stock in more recent days, making it an indicator that is more responsive to new information.
Hull Moving Average (HMA): It measures the average price of an asset over a period of time.
Volume weighted average price (VWAP): It is just a moving average but puts Volume into the calculation.
Point of control (POC): It is the price level at which the greatest number of contracts are traded during a given trading period.
Relative strength index (RSI): It compares a security’s strength on days when prices go up to its strength on days when prices go down.
Moving Average Convergence Divergence: It is a trend-following momentum indicator that shows the relationship between two EMAs of a security's price. The MACD line is calculated by subtracting the 26-period EMA from the 12-period EMA.
High Volume Node (HVN): It refers to the price at which the largest amount of volume occurred.
Disclaimer: The opinions in this article are the author’s and do not necessarily represent the views of Mettis Link News (MLN). Nothing in this article should be considered the sole basis for making financial decisions.
Copyright Mettis Link News
Related News


_20260421112347985_f8783f.jpeg?width=280&height=140&format=Webp)
| Name | Price/Vol | %Chg/NChg |
|---|---|---|
| KSE100 | 177,689.10 323.73M | 3.90% 6667.90 |
| ALLSHR | 107,571.93 852.84M | 3.60% 3735.54 |
| KSE30 | 53,127.72 128.50M | 4.27% 2175.73 |
| KMI30 | 250,518.81 112.77M | 4.11% 9884.94 |
| KMIALLSHR | 68,999.51 408.48M | 3.65% 2426.76 |
| BKTi | 50,815.85 42.71M | 4.40% 2142.62 |
| OGTi | 35,169.09 8.81M | 4.35% 1466.84 |
| Symbol | Bid/Ask | High/Low |
|---|
| Name | Last | High/Low | Chg/%Chg |
|---|---|---|---|
| BITCOIN FUTURES | 65,240.00 | 66,075.00 63,875.00 | 1025.00 1.60% |
| BRENT CRUDE | 87.96 | 93.60 87.93 | -8.82 -9.11% |
| RICHARDS BAY COAL MONTHLY | 105.75 | 0.00 0.00 | -1.55 -1.44% |
| ROTTERDAM COAL MONTHLY | 121.10 | 0.00 0.00 | 0.85 0.71% |
| USD RBD PALM OLEIN | 1,175.00 | 1,175.00 1,175.00 | 0.00 0.00% |
| CRUDE OIL - WTI | 82.57 | 86.20 82.46 | -6.74 -7.55% |
| SUGAR #11 WORLD | 14.55 | 14.75 14.54 | -0.22 -1.49% |
Chart of the Day
Latest News
Top 5 things to watch in this week
Pakistan Stock Movers
| Name | Last | Chg/%Chg |
|---|
| Name | Last | Chg/%Chg |
|---|