Tech Beat: Bitcoin $40,000 in sight?
Abdur Rahman | June 25, 2023 at 10:26 AM GMT+05:00

June 25, 2023 (MLN): The following is an outlook for Bitcoin (BTC/USD) based on technical analysis (historical quantitative data).
BTC/USD Daily time-frame chart:
BTC/USD Daily time-frame:
|
Indicator |
Value |
Stance |
|---|---|---|
|
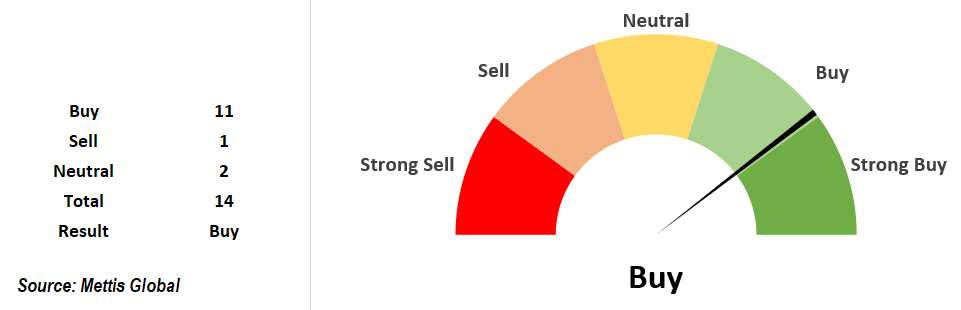
Exponential Moving Average (10) |
28714.53 |
Buy |
|
Simple Moving Average (10) |
28119.72 |
Buy |
|
Exponential Moving Average (20) |
27837.25 |
Buy |
|
Simple Moving Average (20) |
27110.01 |
Buy |
|
Exponential Moving Average (30) |
27564.48 |
Buy |
|
Simple Moving Average (30) |
27157.05 |
Buy |
|
Exponential Moving Average (50) |
27399.25 |
Buy |
|
Simple Moving Average (50) |
27167.34 |
Buy |
|
Exponential Moving Average (100) |
26773.88 |
Buy |
|
Simple Moving Average (100) |
27833.59 |
Buy |
|
Exponential Moving Average (200) |
25555.79 |
Buy |
|
Relative Strength Index (14) |
72.71 |
Neutral |
|
Stochastic %K (14, 3, 3) |
87.41 |
Neutral |
|
Hull Moving Average (9) |
31377.24 |
Sell |
Short/mid-term recommendation:
A retrace towards the support level of $28,500-30,500 will offer a good window for buying, targeting $32,500 and then potentially $38,000-40,000.
Either hedging via a weak altcoin (like BNB/USD) is recommended or a hard stop-loss at $25,000.
Note: The whole case will be invalidated if BlackRock ETF gets a rejection.
Additionally, forces led by Wagner mercenary boss Yevgeniy Prigozhin advanced in the direction of Moscow on Saturday, any sensitive developments from this will also invalidate the scenario.
Base case:
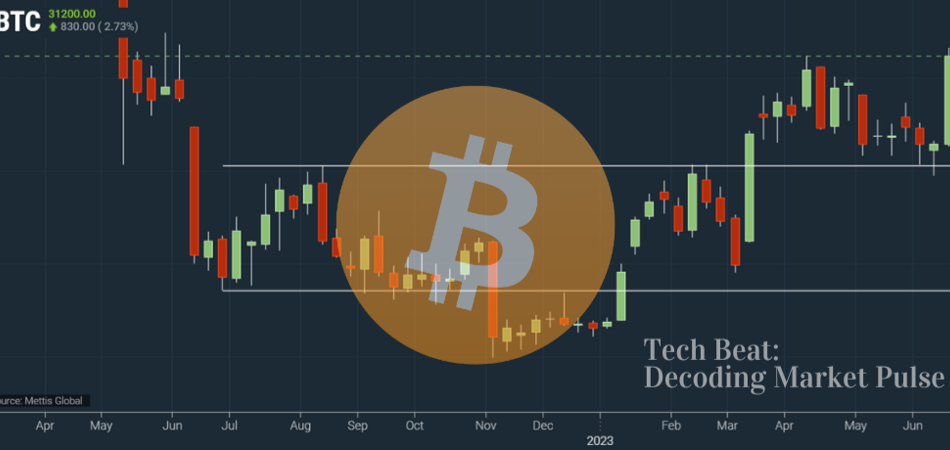
Bitcoin has had the cleanest price action for the past year.
As cryptocurrency is open 24/7, the price action is much cleaner than in other markets due to no data/time lag.
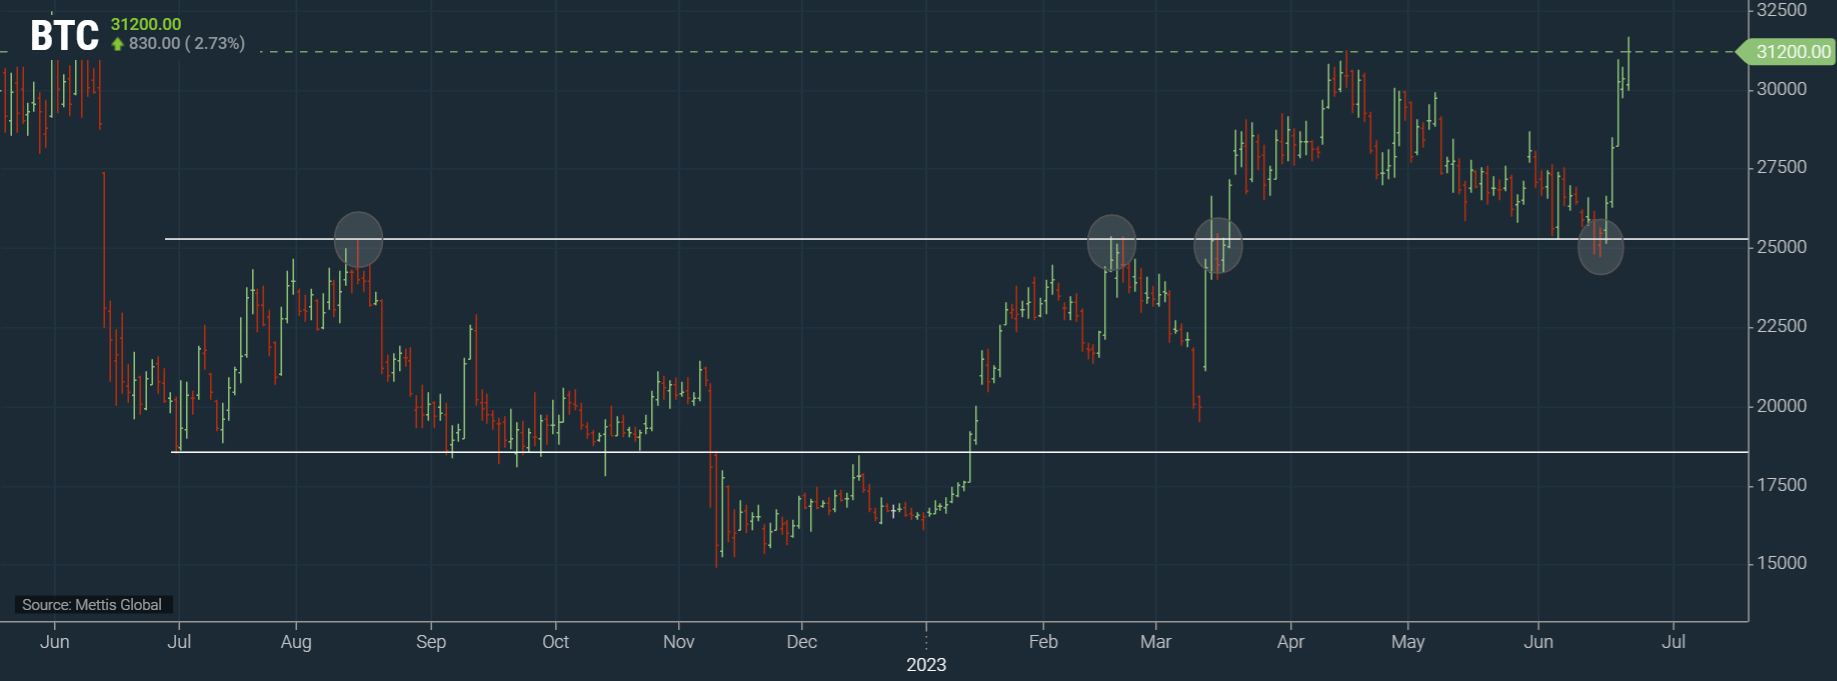
Bitcoin spent nine months in the range of $17,700-25,000 before finally breaking out on March 17.
We saw a perfect retest of this range high ($25,000) a few days ago on June 14, followed by significant buying activity that signaled a breakthrough in the range and a positive continuation in an upward/bullish direction.
We can clearly see in the chart below the $25,000 resistance being tested three times before finally breaking out, and then a retest from above.
This was coupled with BlackRock Inc (NYSE: BLK), the world's biggest asset manager, filing for a bitcoin exchange-traded fund (ETF) on June 15, and Citadel Securities + Fidelity Digital Assets-backed new crypto exchange going live on June 20.
The ETF would allow investors to get exposure to the cryptocurrency as the asset class comes under intense regulatory scrutiny.
A new crypto exchange backed by firms including Citadel Securities, Fidelity Digital Assets, and Charles Schwab Corp could reshape the digital asset landscape amid heightened US scrutiny of the sector.
Market participants are eagerly anticipating the SEC's decision for the ETF. The SEC has previously rejected proposals for spot bitcoin ETFs from firms including Fidelity, Cboe Global Markets, and NYDIG.
However, market participants believe there is a very high probability of the BlackRock ETF being accepted.
BlackRock has a 99.86% success rate in getting ETFs approved, with 576 ETF applications and 575 approved.
Notably, these major moves come at a time when the global cryptocurrency industry has been caught in the crosshairs of the U.S. securities regulator over alleged violations of securities laws.
The US Securities and Exchange Commission has recently widened its crackdown on the crypto industry through lawsuits against two of the biggest firms, Binance and Coinbase, alleging that they acted as unregistered securities exchanges, broker-dealers, and clearinghouses.
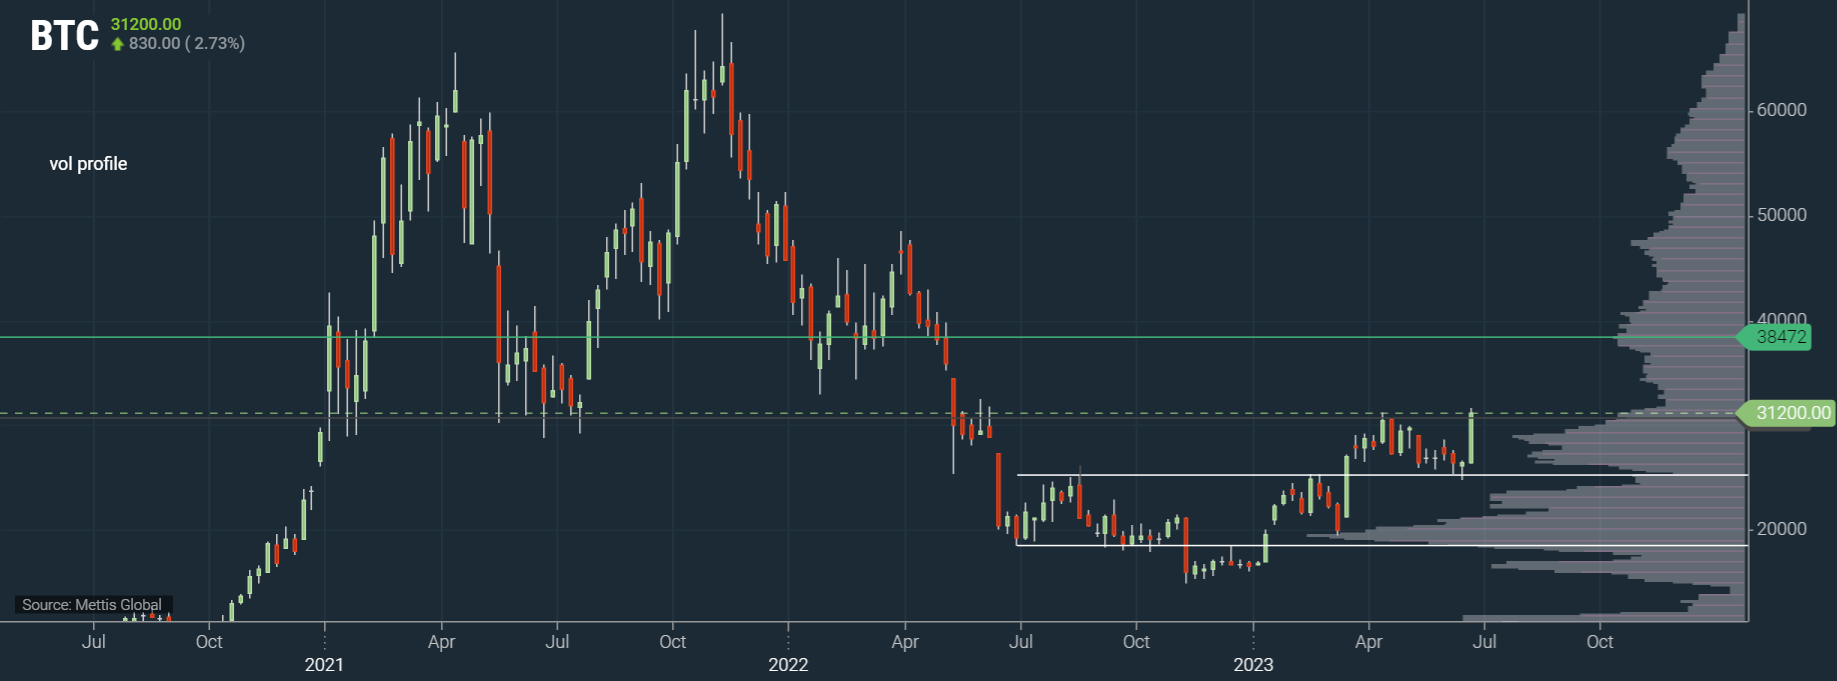
If the ETF is accepted, bitcoin will trade at a minimum of $38,000-40,000.
However, there is currently major resistance at $32,500.
Acceptance above $32,500 will lead to a sharp move towards $38,000-40,000 as there is not much price action/market participation between these ranges, as can be seen by thin volume nodes in the chart below.
BTC/USD Weekly time-frame chart:
Technical terms used:
Moving average (MA): A calculation that takes the arithmetic mean of a given set of prices over a specific number of days in the past.
Exponential moving average (EMA): A weighted average that gives greater importance to the price of a stock in more recent days, making it an indicator that is more responsive to new information.
Volume weighted average price (VWAP): It is just a moving average but puts Volume into the calculation.
Point of control (POC): It is the price level at which the greatest number of contracts are traded during a given trading period.
Relative strength index (RSI): It compares a security’s strength on days when prices go up to its strength on days when prices go down.
High Volume Node (HVN): It refers to the price at which the largest amount of volume occurred.
Disclaimer: The opinions in this article are the author’s and do not necessarily represent the views of Mettis Link News (MLN).
Copyright Mettis Link News
Related News


| Name | Price/Vol | %Chg/NChg |
|---|---|---|
| KSE100 | 173,518.82 409.23M | -3.56% -6408.23 |
| ALLSHR | 105,463.40 895.64M | -3.48% -3807.29 |
| KSE30 | 51,709.62 172.22M | -3.72% -1996.09 |
| KMI30 | 244,367.91 157.85M | -3.61% -9164.01 |
| KMIALLSHR | 67,803.26 534.35M | -3.35% -2349.37 |
| BKTi | 49,017.52 55.15M | -3.88% -1979.98 |
| OGTi | 34,971.98 16.59M | -3.44% -1244.10 |
| Symbol | Bid/Ask | High/Low |
|---|
| Name | Last | High/Low | Chg/%Chg |
|---|---|---|---|
| BITCOIN FUTURES | 64,980.00 | 65,255.00 64,585.00 | 265.00 0.41% |
| BRENT CRUDE | 85.66 | 86.35 85.02 | 0.93 1.10% |
| RICHARDS BAY COAL MONTHLY | 105.75 | 0.00 0.00 | -1.30 -1.21% |
| ROTTERDAM COAL MONTHLY | 119.00 | 119.50 118.50 | -0.50 -0.42% |
| USD RBD PALM OLEIN | 1,135.00 | 1,135.00 1,135.00 | 0.00 0.00% |
| CRUDE OIL - WTI | 79.90 | 80.59 79.59 | 0.56 0.71% |
| SUGAR #11 WORLD | 14.92 | 15.00 14.67 | 0.17 1.15% |
Chart of the Day
Latest News
Top 5 things to watch in this week
Pakistan Stock Movers
| Name | Last | Chg/%Chg |
|---|
| Name | Last | Chg/%Chg |
|---|