Petroleum import bill drops by 29.46% YoY to $1.1 in March: SBP

MG News | April 22, 2024 at 05:31 PM GMT+05:00

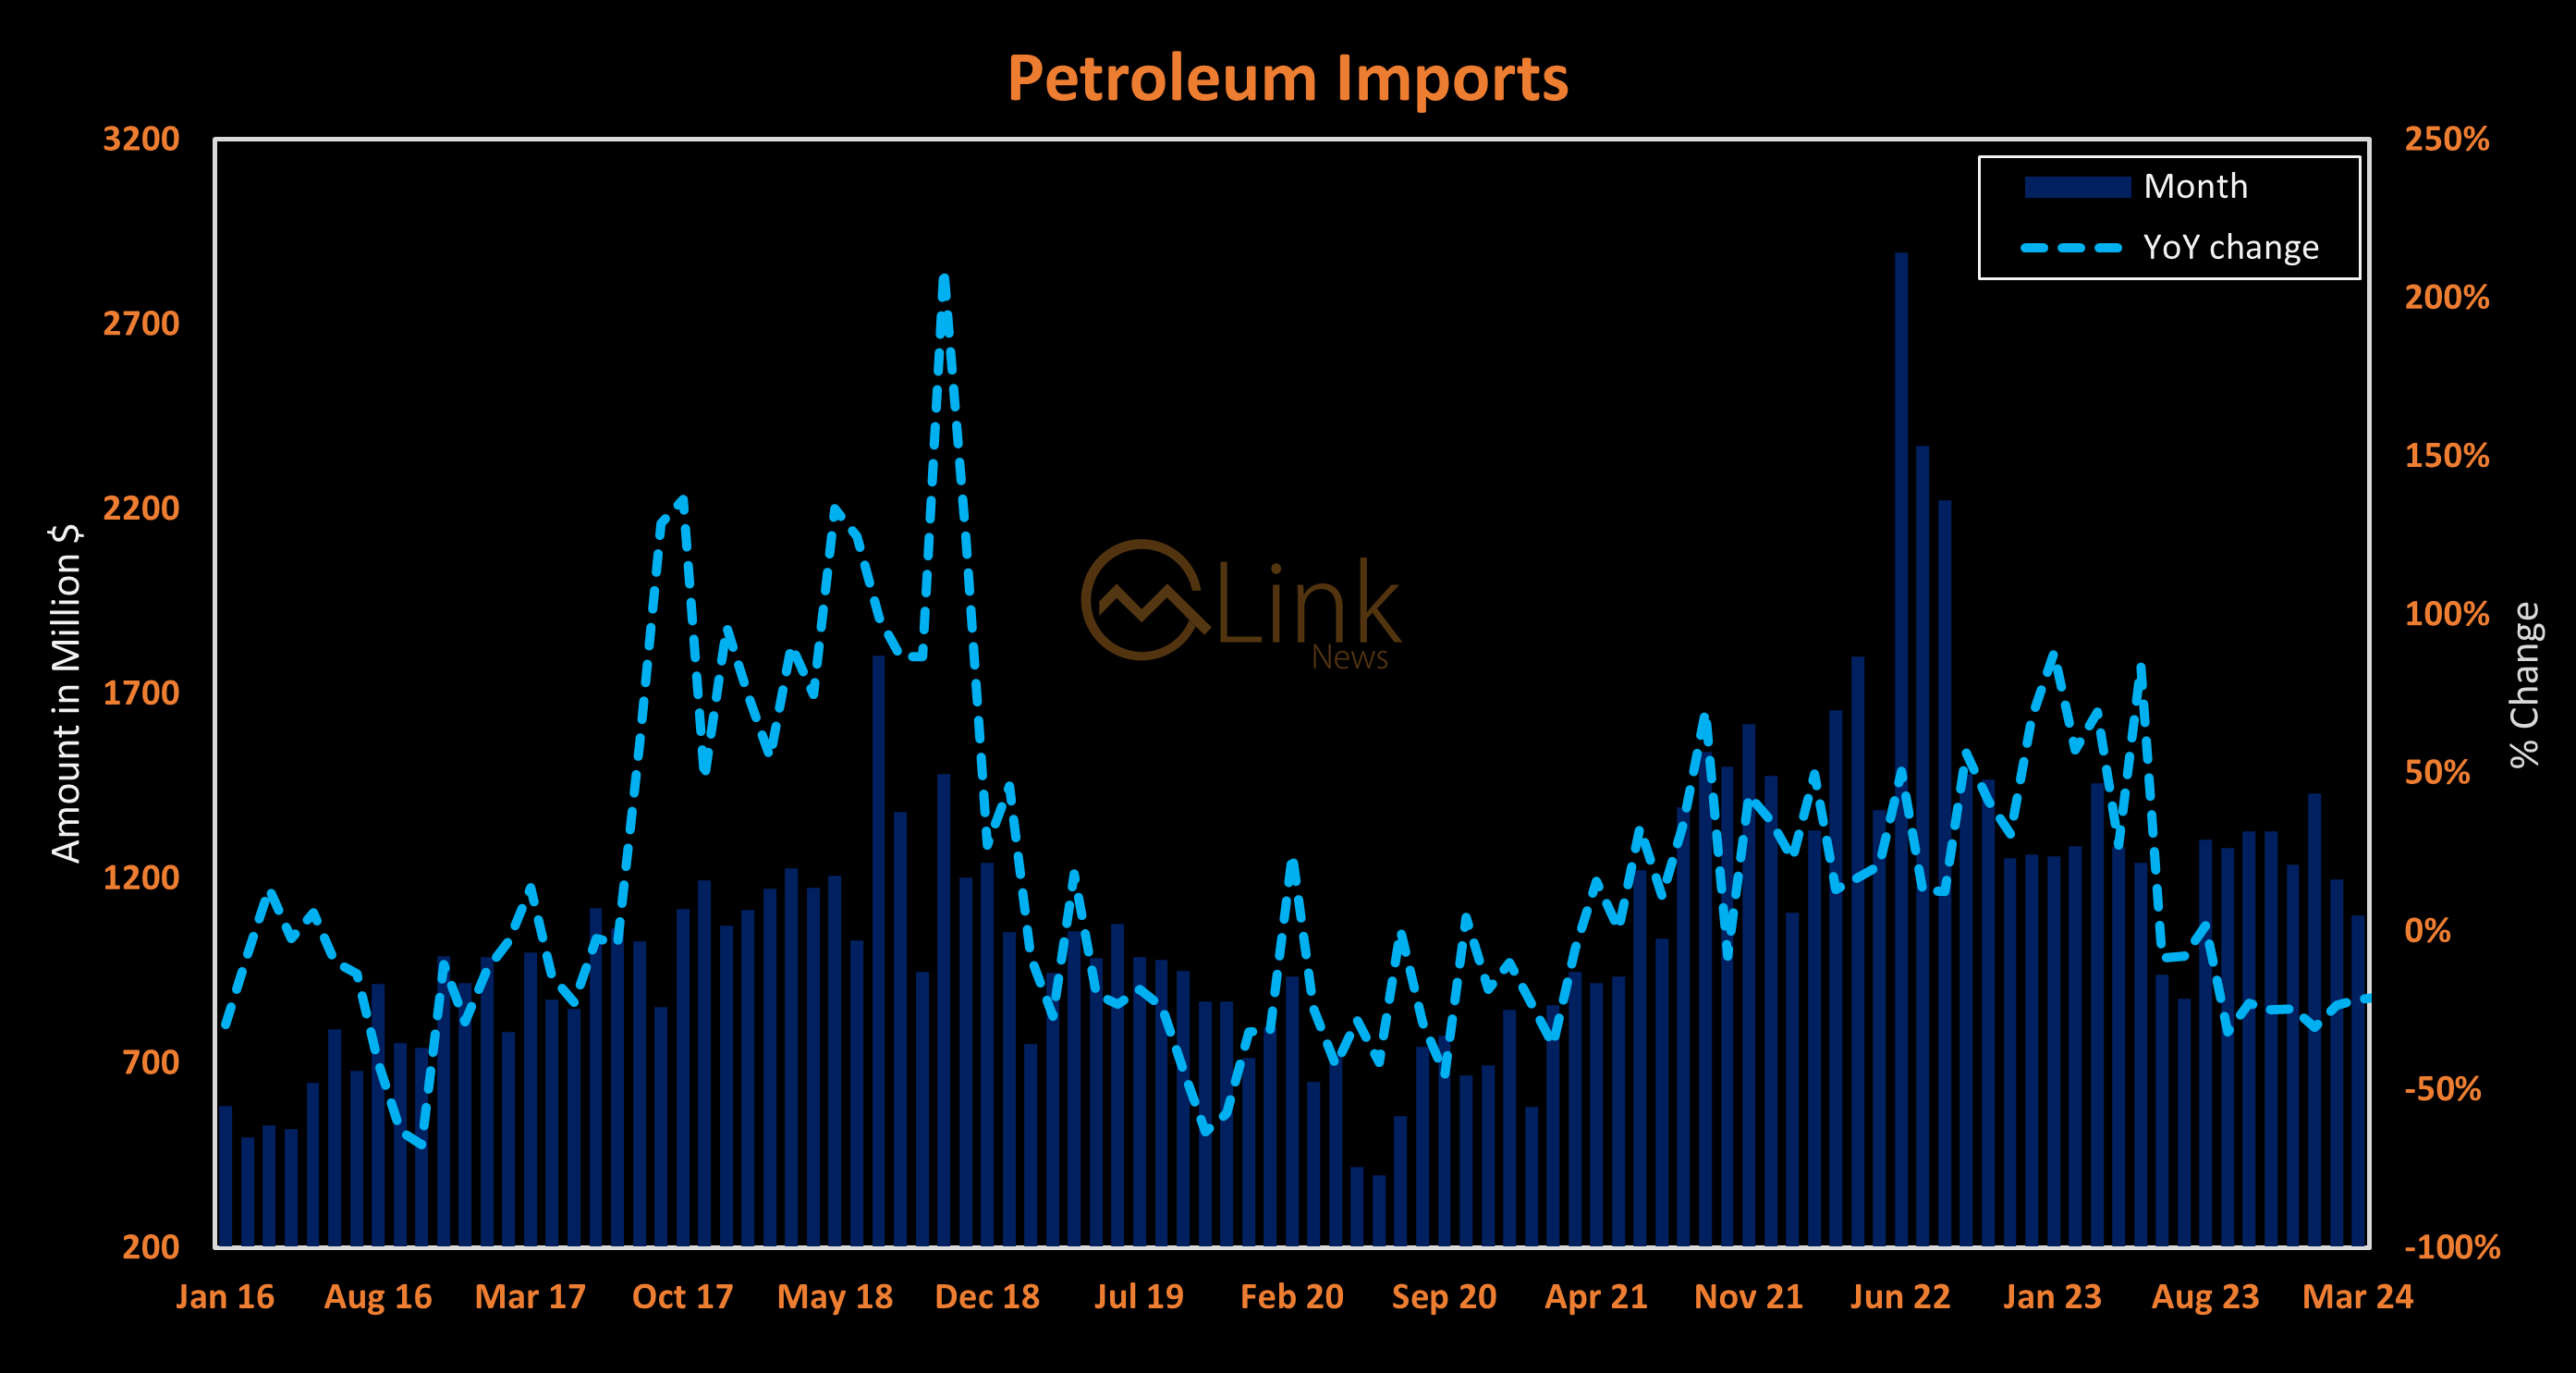
April 22, 2024 (MLN): The import bill of the petroleum group declined to $1.1 billion in March 2024, marking a decrease of 29.46% YoY compared to the import bill of $1.56bn recorded in March 2023, data released by the State Bank of Pakistan (SBP) showed.
Similarly, the imports of petroleum products went down by 8.18% MoM compared to the bill of $1.2bn in February 2024.
The share of petroleum products in the total import bill stood at 24.7% in March 2024.
In 9MFY24, the import bill of petroleum products went significantly down by 26.71% YoY to $11.08bn against $15.12bn recorded in the same period last year.
It is pertinent to mention that the overall import bill has increased by 7% YoY to $4.45bn in March.
Likewise, on a monthly basis, imports increased by 2.23% MoM compared to the imports worth $4.35bn recorded in February 2024.
Cumulatively in 9MFY24, total imports marked a drop of 7.98% YoY to $38.78bn compared to imports of $42.14bn in 9MFY23.
With regards to the transport sector, the import bill posted a rise of 43.17% YoY to $125.31m in March 2024, against $87.52m in March 2023.
This increase is attributed to a rise in imports of road motor vehicles that stood at $100.67m compared to $79.11m in March 2023, depicting a rise of 27.26% YoY.
Comparison on a sequential basis reflects a decline of 3.46% MoM compared to transport imports of $129.81m in the previous month.
Cumulatively in 9MFY24, imports from the transport sector went up by 13.44% YoY to $1.15bn compared to imports of $1.01bn in 9MFY23.
The second and third-highest imports were by the Food Group and Machinery Group, worth $752.14m and $732.99m, respectively in the review month.
The import of agricultural and other chemicals increased by 8.71% YoY and 5.04% MoM to clock in at $691.23m.
Meanwhile, during 9MFY24, the imports for the same group showed a rise of 2.38% YoY to clock in at $6.73bn.
The country’s food imports went up by 38.98% YoY to $752.14m in March as compared to $541.21m in the same period last year.
Conversely, on a monthly basis, the food group’s import dropped by 0.05% MoM compared to the import worth $752.5m in February.
Under the group, Palm Oil emerged as the dominant food import and stood at $275.83m, up by 50.54% YoY during the review period.
Likewise, the import of Tea rose by 56.12% YoY to clock in at $57.59m in the review month.
On a sequential basis, imports of Palm Oil increased by 24.9% while the imports of Tea grew by 27.4% MoM, respectively.
The fourth major import group was the Agri. & Other Chemical as the outflow of foreign currency stood at $691.23m, observing an increase of 8.71% YoY and 5.04% MoM.
The import bill associated with the metal group clocked at $373.56m, expanding by 83.97% YoY while dropping 9.87% in March.
Under the Textile Group, the country incurred an import expenditure worth $337.21m during the review period, down by 20.48% YoY, while up 12.32%.
Copyright Mettis Link News
Related News
_20260101112329999_0153db_20260209062258909_9180ec.webp?width=280&height=140&format=Webp)


| Name | Price/Vol | %Chg/NChg |
|---|---|---|
| KSE100 | 173,962.82 313.69M | 1.30% 2237.52 |
| ALLSHR | 104,178.62 550.40M | 0.93% 964.13 |
| KSE30 | 52,166.33 164.58M | 1.26% 649.19 |
| KMI30 | 250,496.48 141.11M | 1.59% 3930.77 |
| KMIALLSHR | 67,844.06 318.73M | 1.20% 801.29 |
| BKTi | 47,430.11 44.68M | 0.28% 130.40 |
| OGTi | 36,386.96 9.01M | 0.13% 45.59 |
| Symbol | Bid/Ask | High/Low |
|---|
| Name | Last | High/Low | Chg/%Chg |
|---|---|---|---|
| BITCOIN FUTURES | 74,150.00 | 74,165.00 73,715.00 | 435.00 0.59% |
| BRENT CRUDE | 91.89 | 92.95 89.93 | -0.81 -0.87% |
| RICHARDS BAY COAL MONTHLY | 117.00 | 0.00 0.00 | -0.75 -0.64% |
| ROTTERDAM COAL MONTHLY | 130.25 | 131.75 130.00 | -0.20 -0.15% |
| USD RBD PALM OLEIN | 1,157.50 | 1,157.50 1,157.50 | 0.00 0.00% |
| CRUDE OIL - WTI | 87.76 | 89.02 86.35 | -1.14 -1.28% |
| SUGAR #11 WORLD | 14.07 | 14.35 13.90 | 0.14 1.01% |
Chart of the Day
Latest News
Top 5 things to watch in this week
Pakistan Stock Movers
| Name | Last | Chg/%Chg |
|---|
| Name | Last | Chg/%Chg |
|---|