National Bank's profit doubles to Rs39.52bn in 9MCY23

MG News | October 25, 2023 at 10:33 AM GMT+05:00

October 25, 2023 (MLN): National Bank of Pakistan (PSX: NBP) has revealed its financial statement today for the 9MCY23, as per which the bank posted a profit worth Rs39.52 billion [EPS: Rs18.49], depicting a surge of 2.05x YoY, compared to the profit of Rs19.28bn [EPS: Rs15.99] reported in the same period last year (SPLY).
Going by the income statement, the bank witnessed an increase of 49.78% YoY in its net interest income (NII) to stand at Rs120.93bn, compared to Rs80.74bn in SPLY. The surge in NII is due to a jump in interest-earning (Rs720.02bn), up by 2.19x YoY.
During the period under review, the bank’s total non-markup income inched up by 1.21% YoY to Rs27.69bn, owing to a rise in fee and commission income to clock in at Rs16.41bn, depicting an increase of 6.2% YoY.
However, NBP’s foreign exchange income went significantly down by 51.56% YoY to Rs2.79bn during the review period.
Moreover, the bank reported a share of gain from associates and joint ventures of Rs78.29m and Rs930m respectively in 9MCY23.
In addition, the bank’s provision expense increased massively to Rs9.64bn in 9MCY23, while during the SPLY, provision expense of Rs3.58bn was recorded.
On the expense side, the NBP’s total non-markup expenses increased by 19.36% to Rs66.61bn in 9MCY23 compared to Rs55.81bn in 9MCY22.
The increase was attributed to the jump of 19.12% YoY in the operating expenses from Rs55.75bn in 9MCY22 to Rs66.4bn in 9MCY23.
Similarly, the bank’s other charges also went up during the review period.
On the tax front, the bank paid Rs32.85bn, 2.05x higher than the amount paid in 9MCY22.
| Consolidated financial results for the nine months ended September 30, 2023 ('000 Rupees) | |||
|---|---|---|---|
| Sep-23 | Sep-22 | % Change | |
| Mark-up/return/interest earned | 729,019,613 | 332,371,383 | 119.34% |
| Mark-up/return/interest expensed | 608,092,820 | 251,635,918 | 141.66% |
| Net mark-up/interest income | 120,926,793 | 80,735,465 | 49.78% |
| NON MARK-UP/INTEREST INCOME | |||
| Fee and commission income | 16,409,443 | 15,451,101 | 6.20% |
| Dividend income | 3,281,330 | 3,330,710 | -1.48% |
| Foreign Exchange income | 2,792,394 | 5,764,734 | -51.56% |
| Gain on securities - net | 2,439,978 | 1,090,441 | 123.76% |
| Share of (loss)/profit from joint venture - net of tax | 930,033 | 315,653 | |
| Share of(loss)/profit from associates - net of tax | 78,293 | (68,749) | -213.88% |
| Other income | 1,763,313 | 1,479,374 | 19.19% |
| Total non-mark-up/interest income | 27,694,784 | 27,363,264 | 1.21% |
| Total Income | 148,621,577 | 108,098,729 | 37.49% |
| NON-MARK-UP/INTEREST EXPENSES | |||
| Operating expenses | 66,405,753 | 55,746,293 | 19.12% |
| Other charges | 205,964 | 61,964 | 232.39% |
| Total non mark-up/interest expenses | 66,611,717 | 55,808,257 | 19.36% |
| Profit before provisions | 82,009,860 | 52,290,472 | 56.84% |
| Provisions and write-offs - net | 9,642,945 | 3,578,373 | 169.48% |
| Profit before taxation | 72,366,915 | 48,712,099 | 48.56% |
| Taxation | 32,847,956 | 29,435,018 | 11.59% |
| Profit after taxation | 39,518,959 | 19,277,081 | 105.00% |
| Basic and diluted earnings per share | 18.49 | 9.03 | - |
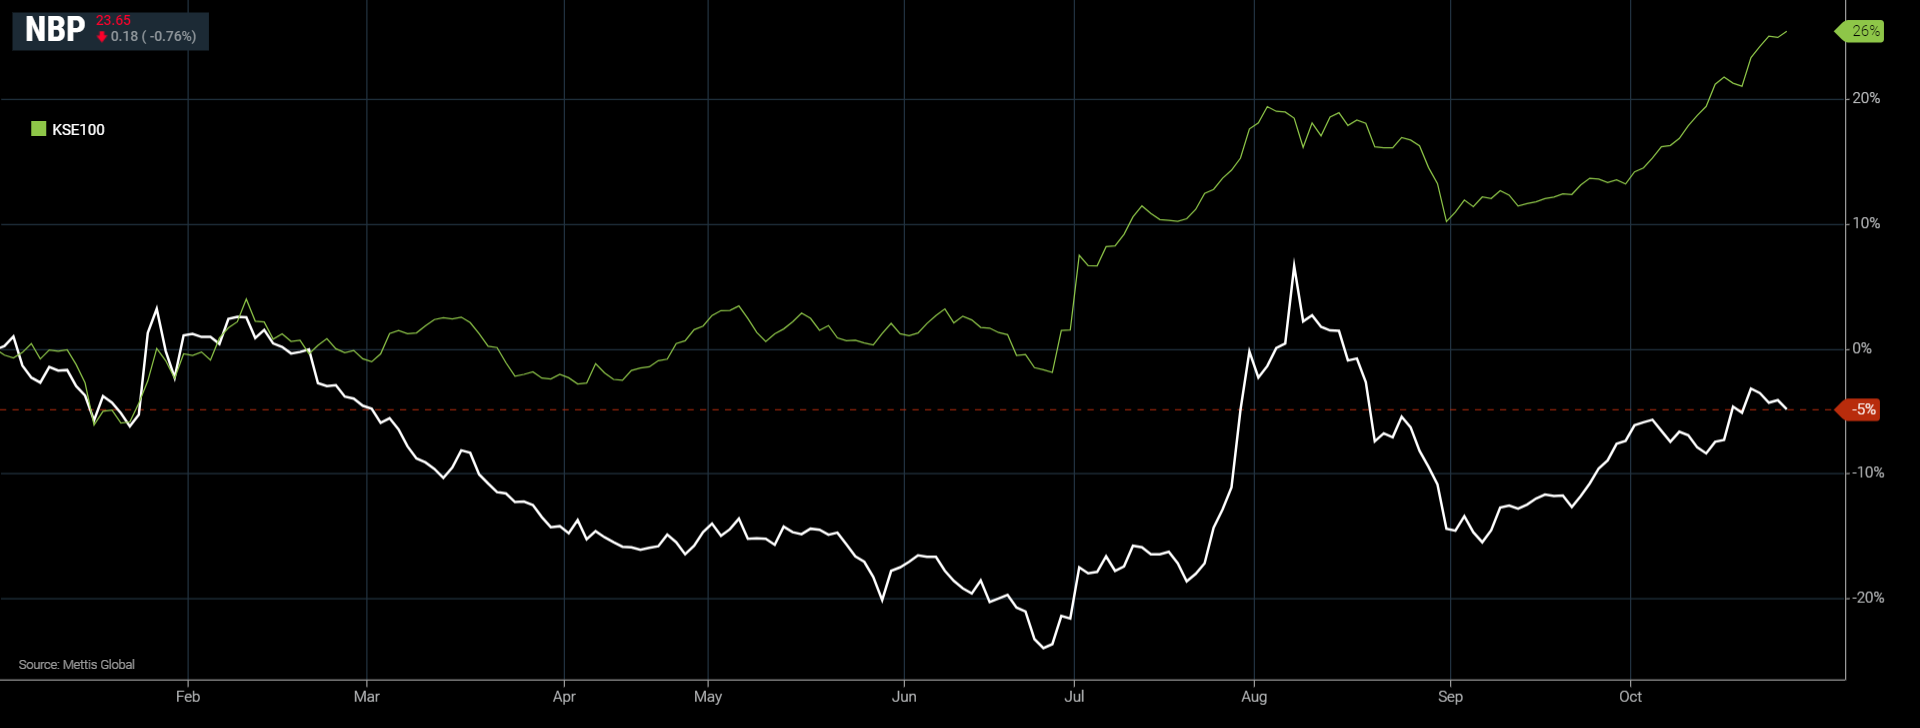
NBP and KSE-100 YTD Performance
Copyright Mettis Link News
Related News


| Name | Price/Vol | %Chg/NChg |
|---|---|---|
| KSE100 | 171,021.20 228.53M | -0.42% -718.25 |
| ALLSHR | 103,836.39 572.65M | -0.41% -422.85 |
| KSE30 | 50,951.99 89.47M | -0.52% -264.77 |
| KMI30 | 240,633.87 93.99M | -0.31% -756.80 |
| KMIALLSHR | 66,572.75 300.61M | -0.28% -185.59 |
| BKTi | 48,673.23 31.18M | -0.70% -343.86 |
| OGTi | 33,702.25 6.35M | -0.61% -205.57 |
| Symbol | Bid/Ask | High/Low |
|---|
| Name | Last | High/Low | Chg/%Chg |
|---|---|---|---|
| BITCOIN FUTURES | 64,520.00 | 64,550.00 63,875.00 | 305.00 0.48% |
| BRENT CRUDE | 98.70 | 101.19 95.13 | -1.99 -1.98% |
| RICHARDS BAY COAL MONTHLY | 105.75 | 0.00 0.00 | -1.55 -1.44% |
| ROTTERDAM COAL MONTHLY | 121.10 | 121.10 121.10 | 0.70 0.58% |
| USD RBD PALM OLEIN | 1,175.00 | 1,175.00 1,175.00 | 0.00 0.00% |
| CRUDE OIL - WTI | 90.47 | 92.83 87.68 | -1.72 -1.87% |
| SUGAR #11 WORLD | 14.76 | 14.79 14.54 | 0.07 0.48% |
Chart of the Day
Latest News
Top 5 things to watch in this week
Pakistan Stock Movers
| Name | Last | Chg/%Chg |
|---|
| Name | Last | Chg/%Chg |
|---|