FABL announces 10% DPS as profit grows to Rs12.31bn in 9MCY23
.png?width=950&height=450&format=Webp)
MG News | October 26, 2023 at 03:18 PM GMT+05:00

October 26, 2023 (MLN): Faysal Bank Limited (PSX: FABL) has revealed its profit for the 9MCY23, as per which the bank’s profit grew by 57.41% YoY to Rs12.31 billion [EPS: 8.11], compared to Rs7.82bn [EPS: 5.15] recorded in the Same Period Last Year (SPLY), bank’s filing on PSX revealed today.
Along with the 9MCY23, the Board of Directors (BoD) of FABL has recommended an interim cash dividend for 3QCY23 at Rs1per share i.e. 10%.
This is in addition to interim Dividend(s) already paid at Rs1per share i.e. 10% for the 2QCY23.
The bank witnessed an increase of 82.5% YoY in its net interest income (NII) to stand at Rs49.15bn, compared to Rs26.93bn in SPLY. The surge in NII is due to a jump in interest-earning (Rs133.36bn), up by 88.94% YoY.
During the period under review, the bank’s total non-markup income also improved by 5.85% YoY to Rs7.5bn, owing to a significant jump in fee, commission, and brokerage income of 30.99% YoY to stand at Rs6.96bn.
Moreover, FABL’s loss on securities also increased to Rs1.95bn during the review period, compared to Rs1.14bn in the SPLY.
The foreign exchange and dividend income reported by the bank fell by 5.18% YoY and 37.21% YoY to Rs2.13bn and Rs231.65m respectively.
Moving forward, the profit and loss statement shows FABL incurred a provision reversal of Rs3.94bn in 9MCY23, compared to a provision expense of Rs735.73m reported in 9MCY22.
On the expense side, the total non-markup expenses expanded by 45.09% YoY to Rs28.27bn in 9MCY23 compared to Rs19.49bn in 9MCY22.
The increase was attributed to a 44.79% YoY jump in operating expenses, rising from Rs19.16bn in 9MCY22 to Rs27.74bn in 9MCY23.
Additionally, the bank’s expenses related to the Workers' Welfare Fund went up during the review period. While other charges were reduced to Rs4.15m during the review period.
On the tax front, the bank paid Rs12.21bn, 63.52% YoY higher than the amount paid in 9MCY22.
| Consolidated Profit and Loss account for the nine months ended September 30th 2023 ('000 Rupees) | |||
|---|---|---|---|
| Sep-23 | Sep-22 | % Change | |
| Mark-up/return/interest earned | 133,358,372 | 70,582,200 | 88.94% |
| Mark-up/return/interest expenses | 84,207,717 | 43,650,568 | 92.91% |
| Net mark-up/interest income | 49,150,655 | 26,931,632 | 82.50% |
| Non-mark-up/interest income | |||
| Fee, commission and brokerage income | 6,960,499 | 5,313,602 | 30.99% |
| Dividend income | 231,646 | 368,913 | -37.21% |
| Foreign exchange income | 2,126,468 | 2,242,692 | -5.18% |
| Income from dealing in foreign currencies | (27,420) | 126,929 | -121.60% |
| (Loss)/Gain on sale of securities - net | (1,945,145) | (1,141,833) | 70.35% |
| Other income | 155,008 | 176,411 | -12.13% |
| Total non-mark-up/interest income | 7,501,056 | 7,086,714 | 5.85% |
| Total income | 56,651,711 | 34,018,346 | 66.53% |
| Non mark-up/interest expenses | |||
| operating expenses | 27,739,074 | 19,157,675 | 44.79% |
| Workers welfare fund | 531,236 | 312,167 | 70.18% |
| Other charges | 4,146 | 17,386 | -76.15% |
| Total non-mark-up/interest expenses | 28,274,456 | 19,487,228 | 45.09% |
| Profit before provisions | 28,377,255 | 14,531,118 | 95.29% |
| Provision/(reversal of provision) and recoveries against writeb-off debts-net | 3,937,291 | (735,729) | -635.16% |
| Share of profit of associate | 80,827 | 21,105 | |
| Extraordinary/unusual items | - | - | |
| Profit before taxation | 24,520,791 | 15,287,952 | 60.39% |
| Taxation | 12,212,119 | 7,468,348 | 63.52% |
| Profit after taxation | 12,308,672 | 7,819,604 | 57.41% |
| Basic and diluted earnings per share (Rupees) | 8.11 | 5.15 | - |
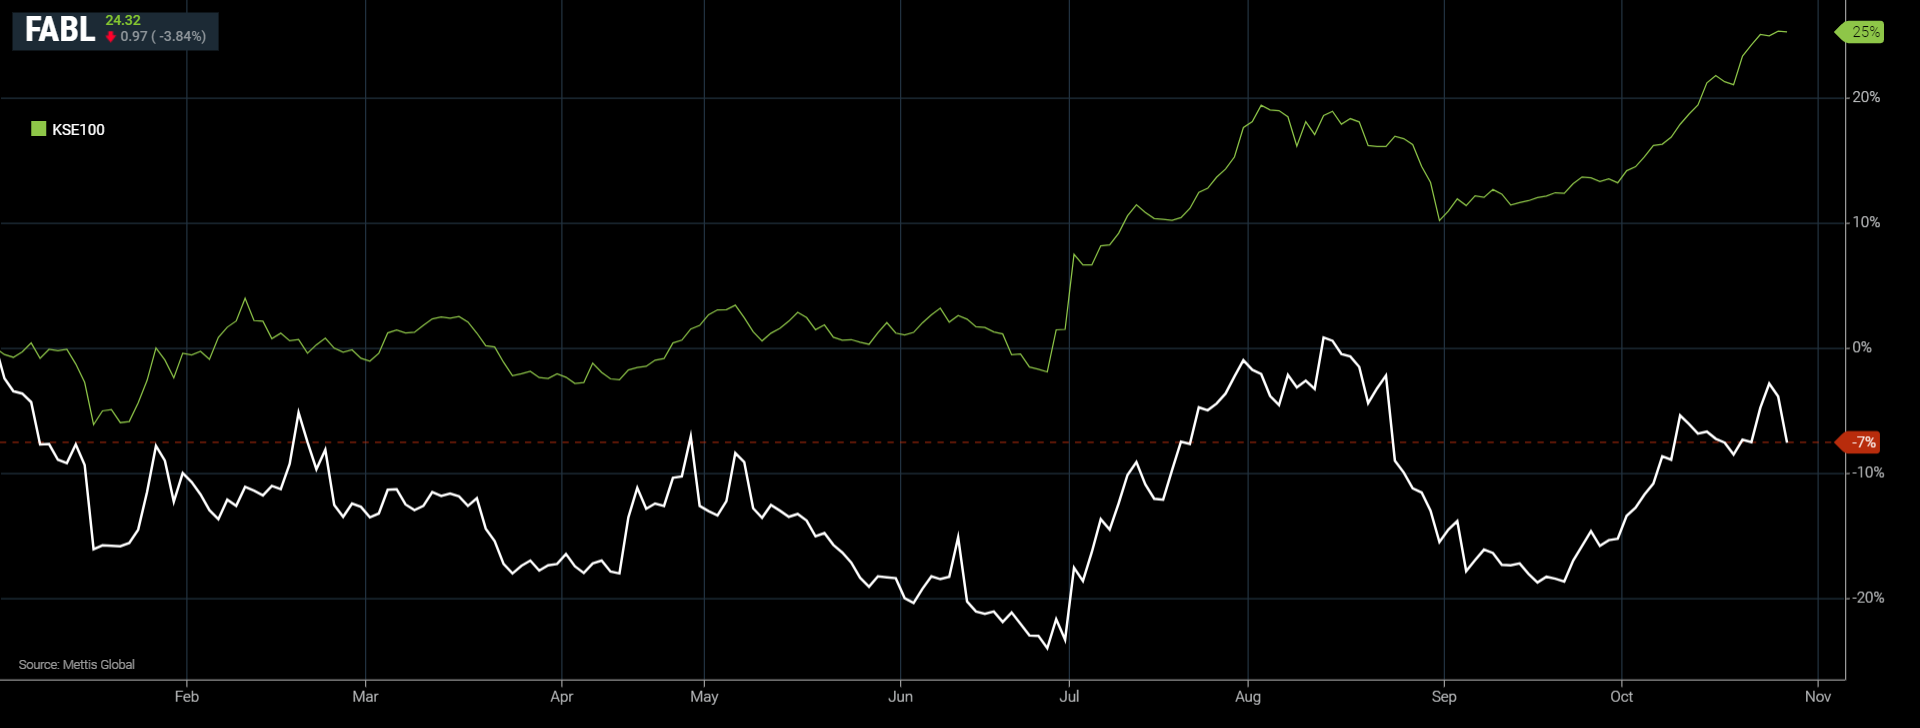
FABL and KSE-100 YTD Performance
Copyright Mettis Link News
Related News


| Name | Price/Vol | %Chg/NChg |
|---|---|---|
| KSE100 | 171,725.29 261.56M | 2.31% 3881.05 |
| ALLSHR | 103,214.49 498.64M | 2.00% 2024.02 |
| KSE30 | 51,517.14 135.33M | 2.40% 1209.13 |
| KMI30 | 246,565.71 111.44M | 2.29% 5524.54 |
| KMIALLSHR | 67,042.77 274.55M | 1.94% 1273.86 |
| BKTi | 47,299.71 43.26M | 3.04% 1394.54 |
| OGTi | 36,341.37 10.64M | 2.20% 783.44 |
| Symbol | Bid/Ask | High/Low |
|---|
| Name | Last | High/Low | Chg/%Chg |
|---|---|---|---|
| BITCOIN FUTURES | 76,720.00 | 77,935.00 76,105.00 | 945.00 1.25% |
| BRENT CRUDE | 100.06 | 100.07 97.12 | 3.92 4.08% |
| RICHARDS BAY COAL MONTHLY | 110.00 | 0.00 0.00 | -8.75 -7.37% |
| ROTTERDAM COAL MONTHLY | 111.10 | 111.10 111.10 | 0.35 0.32% |
| USD RBD PALM OLEIN | 1,157.50 | 1,157.50 1,157.50 | 0.00 0.00% |
| CRUDE OIL - WTI | 93.55 | 93.90 89.41 | -3.05 -3.16% |
| SUGAR #11 WORLD | 14.54 | 14.63 14.44 | -0.16 -1.09% |
Chart of the Day
Latest News
Top 5 things to watch in this week
Pakistan Stock Movers
| Name | Last | Chg/%Chg |
|---|
| Name | Last | Chg/%Chg |
|---|