Emerging markets see nearly $16bn net inflow in February

MG News | March 20, 2025 at 02:12 PM GMT+05:00

March 20, 2025 (MLN): Non-resident portfolio flows to emerging markets registered a net inflow of $15.9 billion in February, continuing the divergence seen in previous months between debt and equity markets.
Debt inflows remained resilient at $18.1bn, while equities struggled, recording a $2.1bn outflow, according to the report "Capital Flows Tracker – March 2025" by the Institute of International Finance.
Once again, China stood out with $11.2bn in equity inflows, reinforcing its decoupling from the broader EM equity trend.
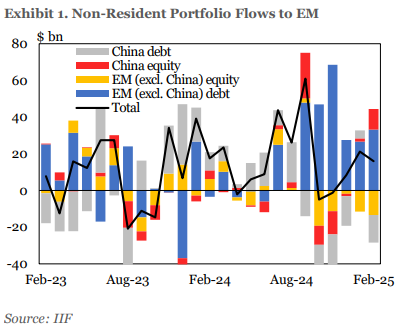
EM (x\China) equities extended their struggles in February, with capital outflows reflecting persistent investor caution amid global uncertainty.
While China saw notable inflows, broader EM equities failed to capitalize on the strength in developed markets, where major indices posted solid gains.
The MSCI Emerging Markets Index rose just 2%, underperforming the MSCI World Index, which gained 4%.
Fund positioning remained volatile, particularly in China, where inflows were countered by institutional investors reducing exposure, the report added.
Some investors selectively increased allocations to key sectors such as technology, but concerns over economic growth and policy risks persisted.
Meanwhile, equity outflows from India, South Korea, and Taiwan accelerated, driven by trade tensions, weak earnings expectations, and scrutiny of semiconductor exports.
The continued strength of the U.S. dollar (albeit a weakening trend lately) added further pressure on Asian EM currencies, compounding the equity market’s challenges.
Debt flows, however, remained robust, with investors maintaining a preference for fixed income amid geopolitical and monetary policy uncertainties.
Local currency debt remained in demand, supported by favorable yield differentials against advanced economies.
Sovereign and corporate issuances saw strong activity, particularly in Latin America and the Middle East, the report further noted.
Mexico and Saudi Arabia led sovereign debt issuance, while Brazil and Chile saw strong demand for corporate bonds, taking advantage of improved market conditions.
The tightening of basis spreads between EM cash bonds and synthetic CDS further signaled confidence in EM credit, with default risks perceived as contained.
China’s $11.2bn in equity inflows sharply contrasted with the broader EM equity outflows.
Renewed optimism in the technology sector, particularly AI and semiconductors, drove investor interest despite lingering concerns over macroeconomic stability.
However, caution around regulatory risks and geopolitical uncertainty remained evident.
Elsewhere, regional capital flow dynamics highlighted stark differentiation.
As commented above, India saw sharp equity outflows due to concerns over earnings growth and extended valuations.
South Korea and Taiwan faced continued capital flight, reflecting supply chain vulnerabilities and uncertainty over potential trade restrictions.
Meanwhile, Latin America remained a bright spot for debt inflows, benefiting from high real interest rates and somewhat stable policy environments.
Looking ahead, EM capital flows will remain highly sensitive to U.S. monetary policy and broader macroeconomic developments.
The Federal Reserve’s messaging has reinforced expectations that interest rates will stay elevated for longer, dampening risk appetite for EM assets.
The strong dollar continues to weigh on EM equities and FX markets, particularly in Asia.
However, demand for EM debt remains resilient, with investors favoring local currency bonds in countries with stable policy frameworks.
As global uncertainty persists, debt is likely to continue outperforming equities in the near term, the report reads.
While EM debt markets maintain their appeal, the outlook for equities remains clouded by external risks and macroeconomic headwinds.
Copyright Mettis Link News
Related News

_20260608055837834_282432.webp?width=280&height=140&format=Webp)

| Name | Price/Vol | %Chg/NChg |
|---|---|---|
| KSE100 | 176,094.12 210.43M | 0.31% 546.13 |
| ALLSHR | 106,530.89 879.03M | 0.30% 313.70 |
| KSE30 | 52,480.22 54.21M | 0.01% 4.71 |
| KMI30 | 247,198.06 71.10M | 0.26% 628.83 |
| KMIALLSHR | 68,178.54 320.54M | 0.35% 237.08 |
| BKTi | 50,319.17 20.32M | -0.21% -103.75 |
| OGTi | 34,316.47 3.14M | 0.13% 43.33 |
| Symbol | Bid/Ask | High/Low |
|---|
| Name | Last | High/Low | Chg/%Chg |
|---|---|---|---|
| BITCOIN FUTURES | 63,065.00 | 63,220.00 62,430.00 | -65.00 -0.10% |
| BRENT CRUDE | 91.04 | 91.36 84.62 | 4.16 4.79% |
| RICHARDS BAY COAL MONTHLY | 107.75 | 0.00 0.00 | -0.25 -0.23% |
| ROTTERDAM COAL MONTHLY | 121.60 | 121.65 121.60 | 0.95 0.79% |
| USD RBD PALM OLEIN | 1,175.00 | 1,175.00 1,175.00 | 0.00 0.00% |
| CRUDE OIL - WTI | 86.80 | 86.87 81.06 | 3.21 3.84% |
| SUGAR #11 WORLD | 14.65 | 14.78 14.38 | 0.22 1.52% |
Chart of the Day
Latest News
Top 5 things to watch in this week
Pakistan Stock Movers
| Name | Last | Chg/%Chg |
|---|
| Name | Last | Chg/%Chg |
|---|