August 24, 2022 (MLN): Bank Al-Habib Limited (BAHL) has posted a consolidated net profit of Rs9.6 billion (EPS: Rs8.63) during 1HCY22, i.e., 5% higher than the net profits of Rs9.1bn (EPS: Rs8.21) recorded in the same period of the calendar year 2021.
This subdued growth in profitability is due to higher taxation, however, net interest income (NII) and notable growth in non-funded income (NFI) supported the bottom line.
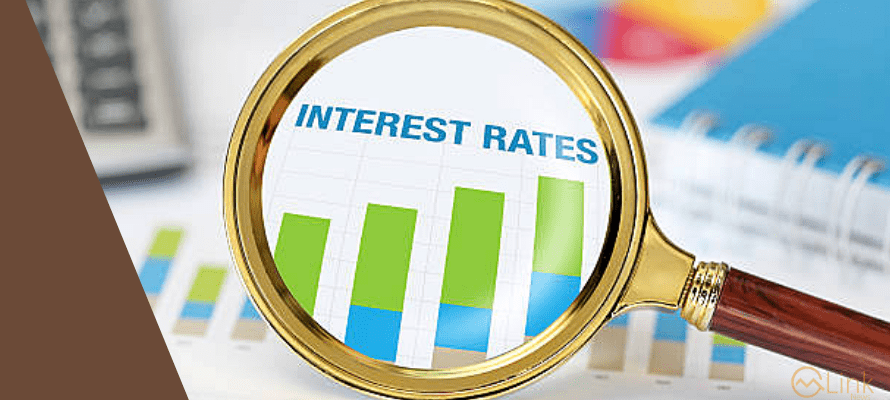
Going by the financial results, the bank’s interest income went up by 39.5% YoY while interest expenses surged by around 54.2% YoY, hence BAHL’s net interest income (NII) stood at Rs34bn, witnessing a jump of 24.7% YoY owing to a repricing of assets at higher rate amid an increase in the policy rate.
While non-funded income (NFI) of the bank observed a 62% YoY increase to Rs10.2bn due to a 32% increase in fee and commission income, around 3x YoY upsurge in foreign exchange income coupled with capital gains on securities of Rs167mn, up by 11.6 times YoY during the said period.
On the provision side, the bank reported a provision of Rs654mn in 1HCY22 when compared to a reversal of Rs28mn reported in 1HCY21, restricting its bottom line.
On the tax front, the effective tax rate stood at 48% from 37% in 1HCY21.
|
Consolidated Profit and Loss Account for the half year ended June 30, 2022 (Rupees in '000) |
|||
|---|---|---|---|
|
|
Jun-22 |
Jun-21 |
% Change |
|
Mark-up/return/interest earned |
76,820,349 |
55,062,074 |
39.52% |
|
Mark-up/return/interest expensed |
(42,641,644) |
(27,655,595) |
54.19% |
|
Net mark-up/return/interest income |
34,178,705 |
27,406,479 |
24.71% |
|
NON-MARK-UP/INTEREST INCOME |
|
|
|
|
Fee and commission income |
5,852,910 |
4,436,173 |
31.94% |
|
Dividend income |
259,904 |
162,802 |
59.64% |
|
Foreign exchange income |
3,108,743 |
1,049,000 |
196.35% |
|
Income/(loss) from derivatives |
– |
– |
– |
|
Gain on securities – net |
167,110 |
14,339 |
1065.42% |
|
Share of profit from associates |
363,659 |
139,074 |
161.49% |
|
Other income |
427,615 |
467,698 |
-8.57% |
|
Total non-mark-up/interest income |
10,179,941 |
6,269,086 |
62.38% |
|
Total Income |
44,358,646 |
33,675,565 |
31.72% |
|
NON-MARK-UP/INTEREST EXPENSES |
|
|
|
|
Operating expenses |
(24,915,032) |
(18,940,345) |
31.54% |
|
Worker’s welfare fund |
(385,165) |
(297,272) |
29.57% |
|
Other charges |
(797) |
(2,078) |
-61.65% |
|
Total non-mark-up/interest expenses |
(25,300,994) |
(19,239,695) |
31.50% |
|
Profit before provisions |
19,057,652 |
14,435,870 |
32.02% |
|
(Provisions)/ reversals and write offs – net |
(654,507) |
28,230 |
– |
|
Extra-ordinary / unusual items |
– |
– |
|
|
Profit before taxation |
18,403,145 |
14,464,100 |
27.23% |
|
Taxation |
(8,811,543) |
(5,329,090) |
65.35% |
|
Profit after taxation |
9,591,602 |
9,135,010 |
5.00% |
|
Earnings per share – Basic and Diluted (in Rupees) |
8.63 |
8.21 |
5.12% |
Copyright Mettis Link News
Posted on:2022-08-24T14:48:55+05:00
34750