
Weekly Market Roundup
_20260829075512768_e71551.jpeg?width=950&height=450&format=Webp)
MG News | August 29, 2026 at 12:59 PM GMT+05:00

August 29, 2026 (MLN): The benchmark KSE-100 Index closed
the week ended August 28, 2026, at 177,696.51 points, gaining 529.99 points, or
0.30%, on a week-on-week basis from 177,166.52 points recorded on August 21,
2026.
Investor sentiment remained cautious during the week, as
profit-taking in key oil and other heavyweight stocks offset gains in banking,
cement, fertilizer and power stocks, keeping the KSE-100 Index’s weekly advance
limited.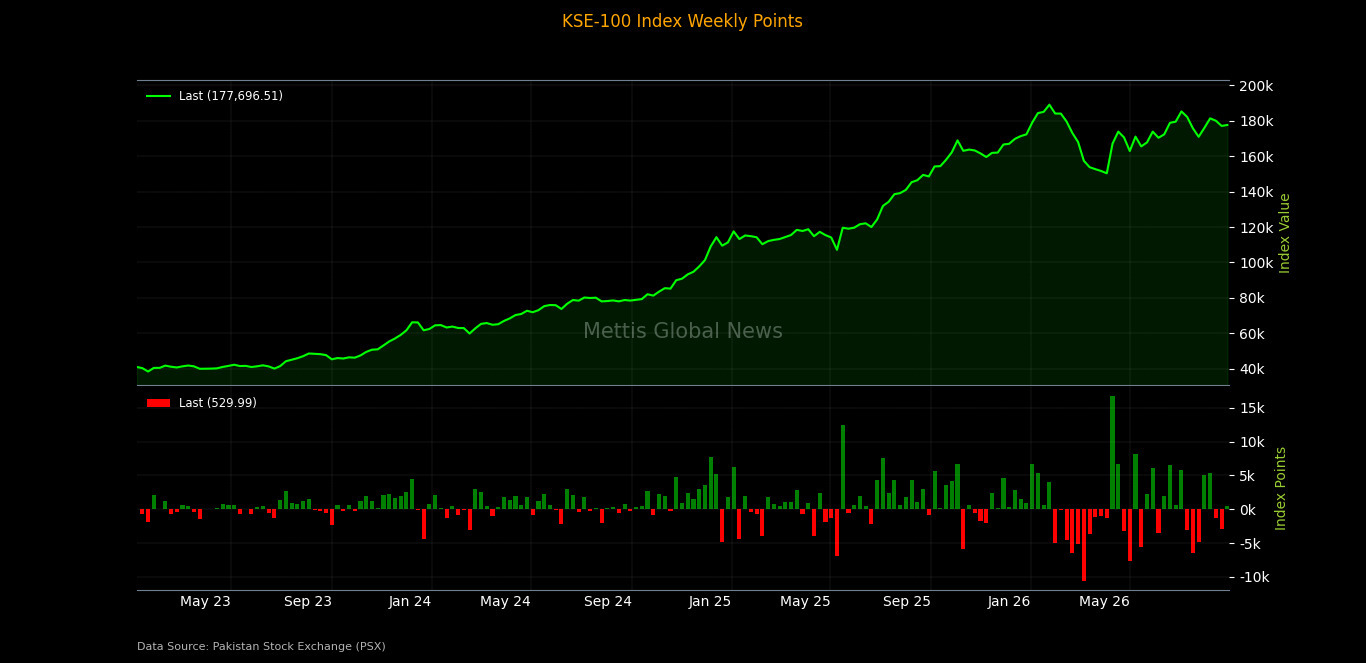
Market Capitalization
The Pakistan Stock Exchange's market capitalization
increased by Rs12.73bn during the week, rising from Rs5.006tr on August 21 to
Rs5.018tr on August 28, representing a 0.25% WoW increase.
In dollar terms, market capitalization increased from
$18.034bn to $18.084bn, registering a rise of approximately $49.72m over the
week.
_20260829075506425_21f936.jpeg)
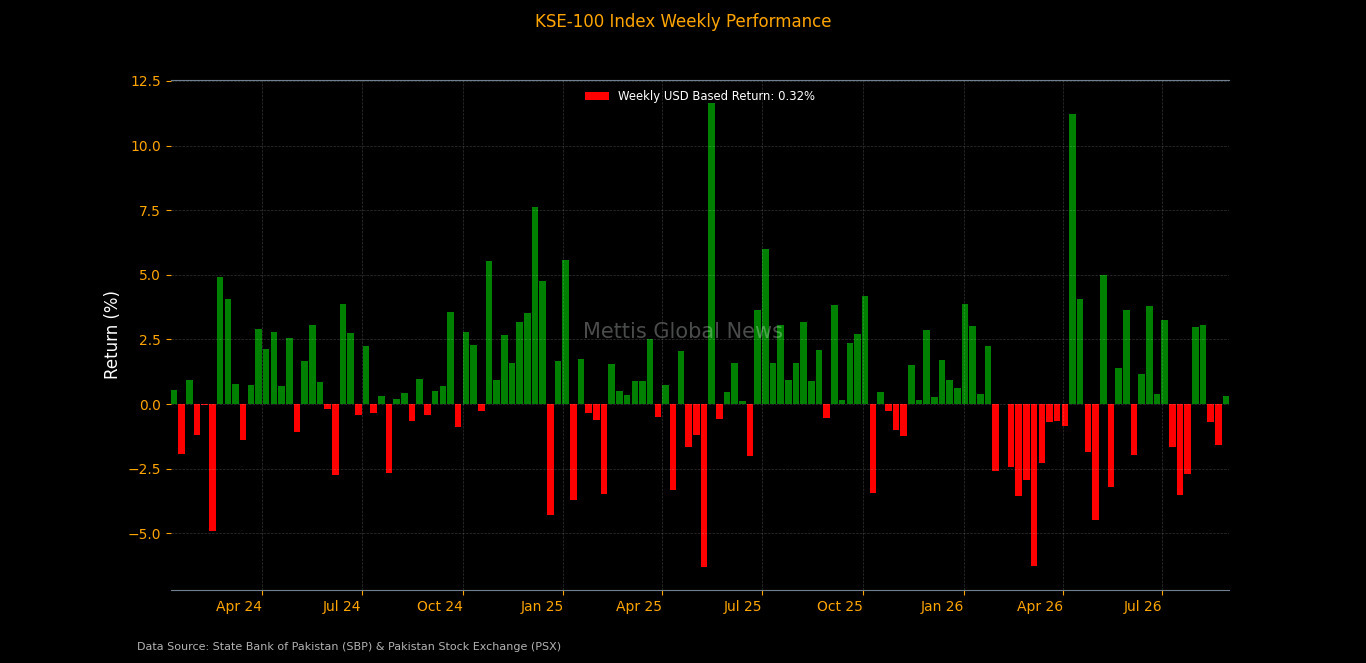
The market's USD-adjusted return stood at 0.32%, compared
with -1.60% in the previous week, reflecting the benchmark's weekly recovery
after accounting for currency movements.
On the macroeconomic front, Pakistan’s
broad money supply (M3) declined 2.32% MoM to Rs49.35tr in July 2026, while
rising 10.91% YoY.
Pakistan received
$763.03m in foreign economic assistance in July 2026,
including $344m through Naya Pakistan Certificates, $146.62m from China for the
C-5 project, and $252.83m from multilateral partners.
Scheduled banks’
deposits rose 13.93% YoY to Rs39.05tr in July 2026, while advances
increased 8.98% and investments grew 12.82% YoY.
SBP-held foreign
exchange reserves increased $16.6m WoW to $17.1bn during the week
ended August 21, 2026, while total liquid reserves rose to $22.59bn.
Weekly SPI
edged up, with short-term inflation rising 0.05% WoW and 9.04% YoY for
the week ended August 27, 2026.
Index Movers
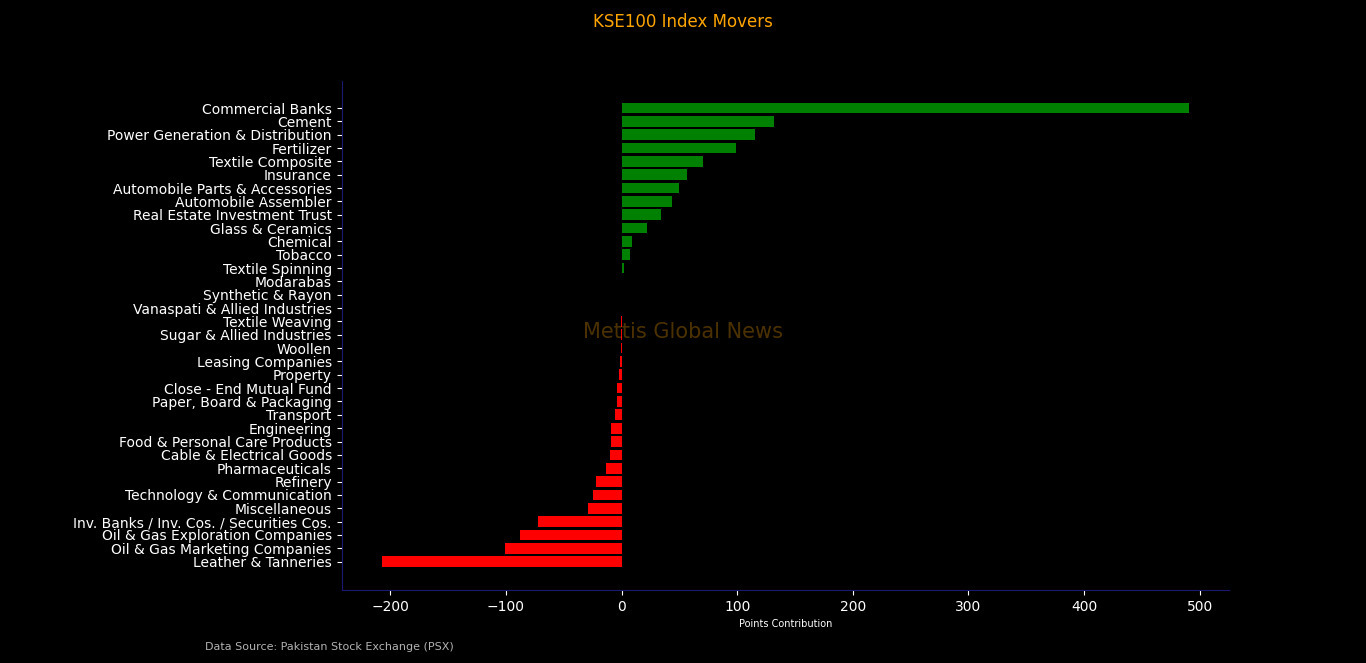
Sector-wise performance was mixed during the week, with
Commercial Banks providing the largest support to the KSE-100 Index at 490.74
points, followed by Cement at 131.93 points, Power Generation &
Distribution at 115.12 points, Fertilizer at 98.88 points and Textile Composite
at 70.26 points.
Other sectors contributing positively included Insurance at
56.80 points, Automobile Parts & Accessories at 49.51 points, Automobile
Assembler at 43.67 points, Real Estate Investment Trust at 34.13 points, Glass
& Ceramics at 22.13 points and Chemical at 9.20 points.
On the negative side, Leather & Tanneries recorded the
largest drag on the benchmark at 207.21 points, followed by Oil & Gas
Marketing Companies at 100.47 points, Oil & Gas Exploration Companies at
87.70 points, Investment Banks/Investment Companies/Securities Companies at
72.18 points and Miscellaneous at 28.62 points.
Other sectors weighing on the index included Technology
& Communication at 24.87 points, Refinery at 22.16 points, Pharmaceuticals
at 13.29 points, Cable & Electrical Goods at 9.89 points, Food & Personal
Care Products at 9.39 points and Engineering at 8.77 points.
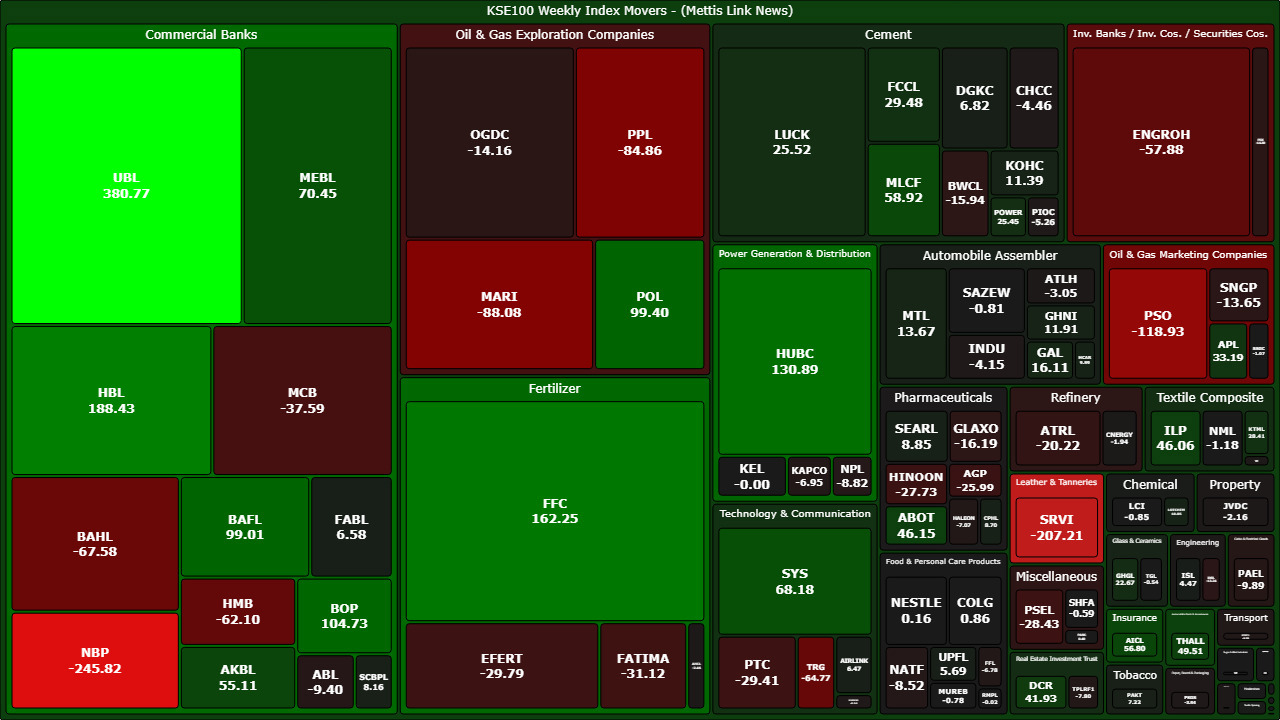
Among individual stocks, UBL emerged as the largest positive
contributor to the index, adding 380.77 points, followed by HBL at 188.43
points, FFC at 162.25 points, HUBC at 130.89 points, BOP at 104.73 points, POL
at 99.40 points, BAFL at 99.01 points, MEBL at 70.45 points, SYS at 68.18
points and MLCF at 58.92 points.
Other notable positive contributors included AICL at 56.80
points, AKBL at 55.11 points, THALL at 49.51 points, ABOT at 46.15 points, ILP
at 46.06 points, DCR at 41.93 points, APL at 33.19 points, FCCL at 29.48 points
and KTML at 28.41 points.
On the downside, NBP was the biggest drag on the benchmark,
erasing 245.82 points, followed by SRVI at 207.21 points, PSO at 118.93 points,
MARI at 88.08 points, PPL at 84.86 points, BAHL at 67.58 points, TRG at 64.77
points, HMB at 62.10 points, ENGROH at 57.88 points and MCB at 37.59 points.
Other major negative contributors included FATIMA at 31.12
points, EFERT at 29.79 points, PTC at 29.41 points, PSEL at 28.43 points,
HINOON at 27.73 points, AGP at 25.99 points and ATRL at 20.22 points.
FIPI/LIPI
Foreign investors remained net sellers during the week,
recording net equity sales of $10.65m.
The selling was primarily driven by Foreign Corporates, which offloaded equities worth $10.88m, while Foreign Individuals recorded net sales of $1.70m.
Meanwhile, Overseas Pakistanis remained net buyers with
purchases of $1.93m.
Including debt flows, foreign investors recorded a net
outflow of $10.65m during the week.
On the local side, investors remained net buyers in the
equity market, recording net purchases of Rs2.95bn ($10.65m).
Mutual Funds emerged as the largest local buyers, with net equity purchases of Rs1.72bn ($6.22m), followed by Companies with Rs1.19bn ($4.28m),
Insurance Companies with Rs319.14m ($1.15m), Individuals with
Rs314.16m ($1.13m) and Other Organizations with Rs405.42m ($1.46m).
The largest sellers were Broker Proprietary Trading, which
offloaded equities worth Rs707.79m ($2.56m), followed by Banks/DFIs with
Rs261.96m ($943,101) and NBFCs with Rs23.42m ($84,522).
In the debt market, Banks/DFIs remained significant net
sellers with Rs16.65bn, while Mutual Funds recorded net purchases of Rs14.76bn._20260829075453725_a024c2.jpeg)
Copyright Mettis Link News
Related News
_20261024054136356_ebb6c5.jpeg?width=280&height=140&format=Webp)
_20261009161631180_9d2ce0.jpeg?width=280&height=140&format=Webp)
| Name | Price/Vol | %Chg/NChg |
|---|---|---|
| KSE100 | 162,374.88 110.96M | -0.95% -1549.44 |
| ALLSHR | 98,620.11 386.58M | -0.91% -906.77 |
| KSE30 | 47,823.16 51.47M | -1.02% -490.65 |
| KMI30 | 232,733.99 57.93M | -1.23% -2903.19 |
| KMIALLSHR | 63,955.68 197.75M | -1.12% -727.41 |
| BKTi | 44,724.17 14.61M | -1.01% -457.04 |
| OGTi | 33,033.72 5.00M | -1.08% -361.88 |
| Symbol | Bid/Ask | High/Low |
|---|
| Name | Last | High/Low | Chg/%Chg |
|---|---|---|---|
| BITCOIN FUTURES | 80,785.00 | 81,450.00 80,440.00 | -420.00 -0.52% |
| BRENT CRUDE | 117.38 | 117.45 112.74 | 4.21 3.72% |
| RICHARDS BAY COAL MONTHLY | 128.50 | 0.00 0.00 | -1.10 -0.85% |
| ROTTERDAM COAL MONTHLY | 147.10 | 0.00 0.00 | 1.10 0.75% |
| USD RBD PALM OLEIN | 1,182.50 | 1,182.50 1,182.50 | 0.00 0.00% |
| CRUDE OIL - WTI | 103.44 | 103.92 98.84 | 3.97 3.99% |
| SUGAR #11 WORLD | 20.26 | 20.51 20.02 | 0.13 0.65% |
Chart of the Day
Latest News
Top 5 things to watch in this week
 Repatriation of Profit and Dividend
Pakistan Stock Movers
| Name | Last | Chg/%Chg |
|---|
| Name | Last | Chg/%Chg |
|---|