Weekly Market Roundup
_20260509193020403_6be451.jpeg?width=950&height=450&format=Webp)
MG News | May 10, 2026 at 12:34 AM GMT+05:00

May 10, 2026 (MLN): Pakistan’s equity market staged a strong
recovery during the week ended May 08, 2026, with the benchmark KSE-100 Index
closing at 171,115.82, sharply higher than 162,994.17 recorded on May 01, 2026.
The index surged 8,121.65 points, translating into a 4.98%
week-on-week (WoW) gain, reversing the previous week’s steep decline as
investor sentiment improved amid aggressive buying in heavyweight banking,
cement, fertilizer, and exploration & production stocks.
Sentiment further improved amid easing concerns over
immediate disruptions in global energy supplies, as hopes for a diplomatic
breakthrough between the United States and Iran and gradual reopening of the
Strait of Hormuz supported risk appetite during the week.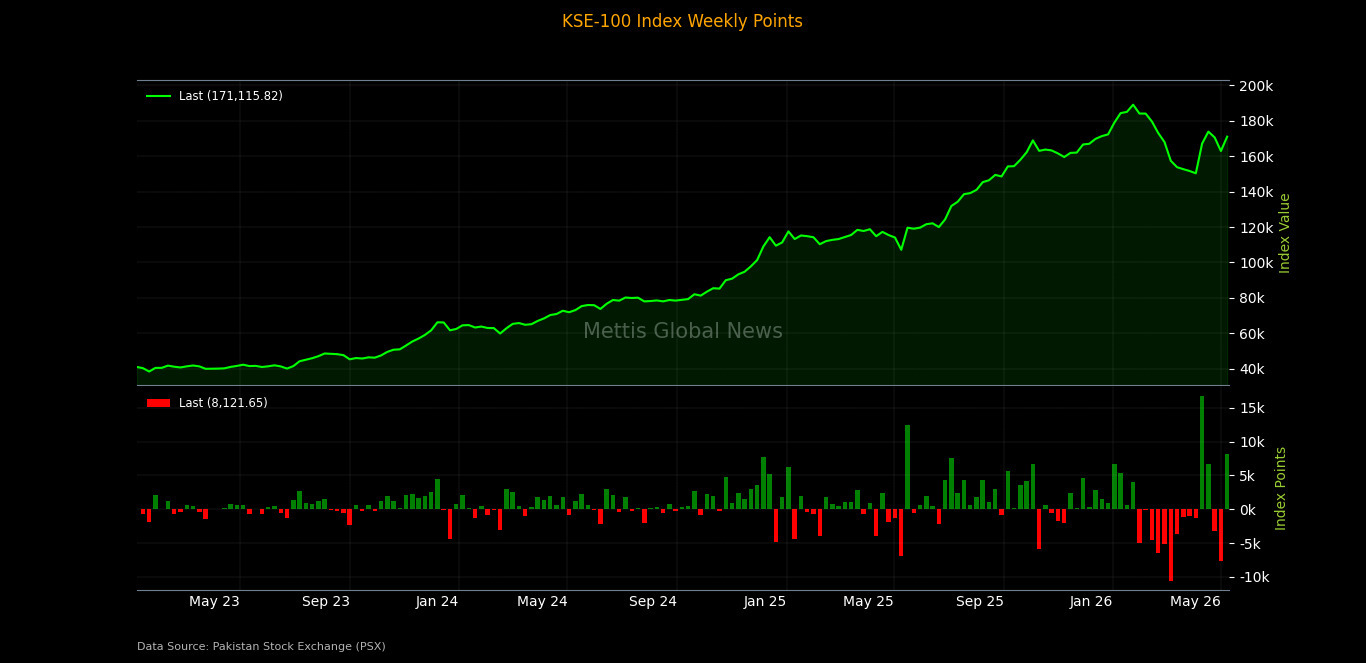
Market Capitalization
Total market capitalization increased significantly in line
with the benchmark index performance. As of May 08, 2026, market capitalization
stood at Rs4.906 trillion, compared to Rs4.695tr on May 01, 2026, marking an
increase of Rs211bn or 4.49% WoW.
In USD terms, market capitalization rose to $17.60bn from
$16.84bn in the previous week, reflecting a notable recovery in overall market
value._20260509193012684_91dc0b.jpeg)
Dollar-adjusted returns also turned sharply positive,
clocking in at 5.01% WoW, compared to negative 4.47% in the prior week,
indicating a strong rebound in investor returns in both local and foreign
currency terms amid broad-based market recovery.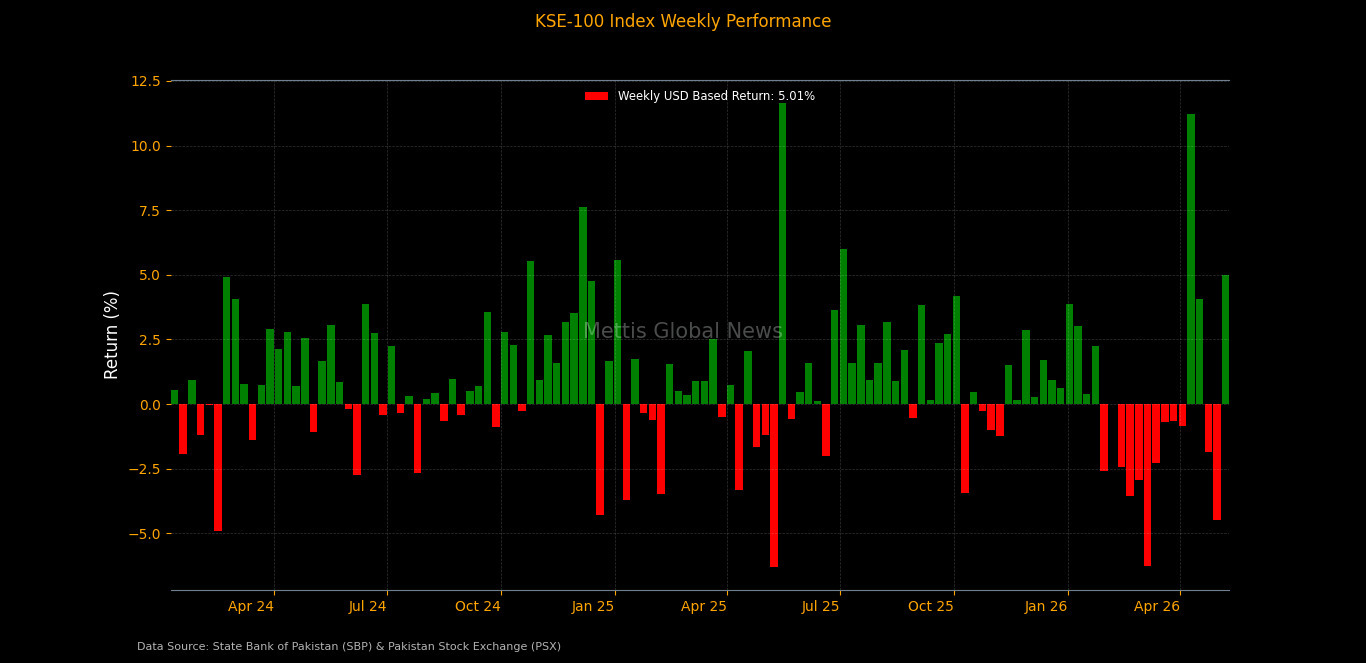
On the macroeconomic front, Pakistan’s foreign
exchange reserves posted a slight increase during the week ended April 30,
2026, with the State Bank of Pakistan’s holdings rising by $22.8m to $15.85bn.
Total liquid reserves of the country also edged up 0.12% WoW
to $21.29bn, supported by marginal growth in commercial banks’ reserves.
Pakistan’s weekly
inflation, measured by the SPI, rose 0.79% WoW for the week ended May 7,
2026, mainly driven by higher prices of chicken, fuel, wheat flour, milk, and
other essential food items, while annual SPI inflation stood at 15.16% YoY.
Pakistan’s large-scale manufacturing sector grew 11.09%
YoY in March 2026, driven by strong performances in automobiles, sugar,
garments, and petroleum products, while cumulative LSMI growth reached 6.48%
during July–March FY26.
Pakistan’s
trade deficit hit a near four-year high of $4.07bn in April 2026 as a
massive import surge overshadowed the recovery in exports.
Pakistan faces foreign currency outflows of $30.86bn
over the coming year, intensifying pressure on external reserves despite
official assets standing at $27.18bn as of March 2026.
Index Movers
Sector-wise, the rally remained heavily concentrated in
index-heavy sectors.
Commercial banks emerged as the largest contributor, adding
2,352.85 points to the benchmark index, reflecting strong buying interest in
major banking names amid improving earnings expectations and institutional
accumulation.
Oil & gas exploration companies added 1,264.99 points,
while cement contributed 1,245.02 points, supported by gains in major blue-chip
stocks across both sectors.
Fertilizer added 910.01 points, followed by technology &
communication (+467.63 points) and automobile assemblers (+342.76 points),
indicating broad participation across cyclical and growth sectors.
Additional positive contributions came from pharmaceuticals
(+255.13 points), investment banks/securities (+225.15 points), oil & gas
marketing companies (+140.54 points), property (+127.81 points), and power
generation & distribution (+118.42 points).
Other supportive sectors included textile composite (+112.87
points), leather & tanneries (+96.08 points), food & personal care
products (+77.47 points), insurance (+71.91 points), and transport (+59.39
points), highlighting the broad-based nature of the market rebound.
On the downside, only a few sectors closed in negative
territory, with automobile parts & accessories dragging the index by 12.32
points, followed by synthetic & rayon (-2.71 points) and refinery (-0.37
points), indicating limited pressure in select pockets of the market.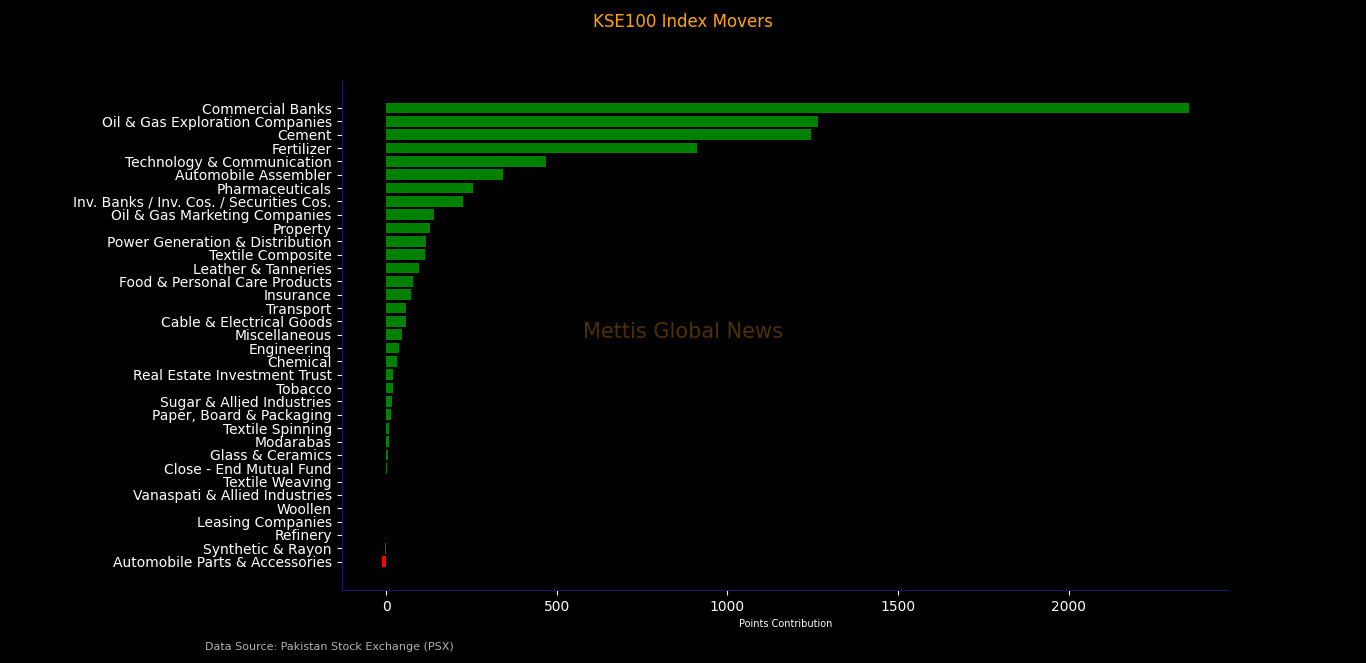
Scrip-wise, the upside was dominated by heavyweight banking,
fertilizer, cement, and exploration stocks.
United Bank Limited led the rally, contributing 1,038.14
points to the index, followed by Fauji Fertilizer Company (+790.66 points), Oil
and Gas Development Company (+595.98 points), and Lucky Cement (+578.13
points).
Other major contributors included Pakistan Petroleum Limited
(+543.35 points), National Bank of Pakistan (+298.70 points), MCB Bank Limited
(+277.93 points), and Systems Limited (+263.33 points).
Additional support came from Habib Bank Limited, Engro
Holdings, Mari Petroleum Company, Sazgar Engineering Works, Maple Leaf Cement,
Millat Tractors, Fauji Cement, and Javedan Corporation, showing strong
participation across banking, energy, cement, technology, and automobile
sectors.
Among other notable gainers were Bank AL Habib, Bank of
Punjab, Pakistan Telecommunication Company, Service Industries, Fatima
Fertilizer, Pioneer Cement, Nishat Mills, The Searle Company, Adamjee
Insurance, Pakistan State Oil, Pakistan International Bulk Terminal, and Pak
Elektron.
On the downside, losses remained limited and concentrated in
a handful of stocks. Indus Motor Company emerged as the largest negative
contributor, dragging the index by 40.80 points, followed by Pakistan Oilfields
Limited (-32.36 points), Attock Refinery (-19.98 points), and Thal Limited
(-12.32 points).
Other laggards included Mahmood Textile Mills, Ghani Glass,
and Ibrahim Fibres, reflecting selective profit-taking in a few sectors despite
the broader market strength.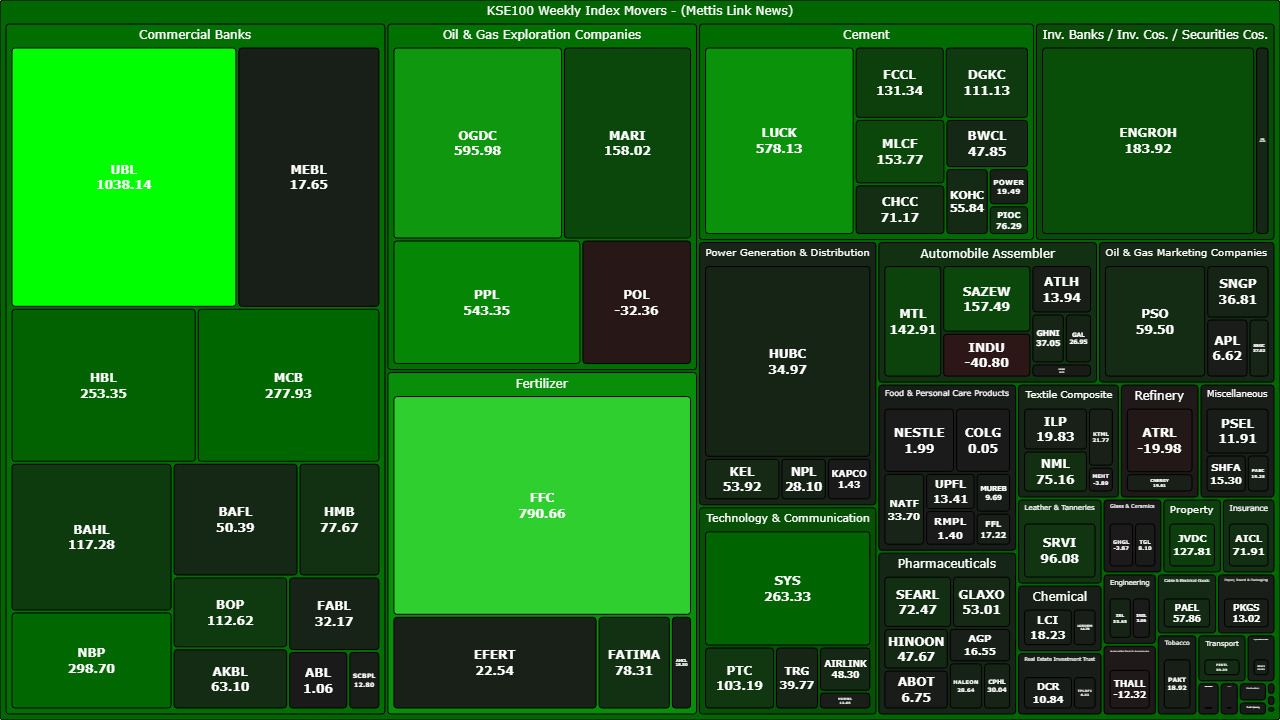
FIPI / LIPI
Foreign investment flows remained negative during the week
under Foreign Institutional Portfolio Investment (FIPI).
Overseas Pakistanis remained net sellers with an outflow of
Rs115.47m ($0.41m), while foreign corporates recorded a net outflow of Rs22.13m
($0.08m).
Foreign individuals, however, posted a marginal net inflow
of Rs0.65m.
Overall, FIPI activity remained subdued and slightly
negative, indicating cautious foreign participation despite the strong rebound
in the benchmark index.
On the domestic side, Local Portfolio Investment (LIPI)
activity remained mixed but largely supportive for the market.
Broker proprietary trading emerged as the largest buyer with
a net inflow of Rs1.69bn, followed by mutual funds (+Rs1.24bn), companies
(+Rs743.06m), other organizations (+Rs320.93m), and NBFCs (+Rs60.27m).
On the other hand, insurance companies remained the largest
sellers with a net outflow of Rs2.73bn, while individuals recorded net selling
of Rs1.02bn and banks & DFIs posted an outflow of Rs165.32m.
Overall equity market flows under LIPI recorded a modest net
inflow of Rs136.96m ($0.49m), reflecting selective institutional accumulation
during the recovery rally.
In the debt market, mutual funds and insurance companies
recorded notable inflows, while banks & DFIs and companies remained net
sellers, indicating continued portfolio rebalancing across fixed-income
instruments._20260509192959314_d868ec.jpeg)
Copyright Mettis Link News
Related News


| Name | Price/Vol | %Chg/NChg |
|---|---|---|
| KSE100 | 179,571.27 436.67M | 1.06% 1878.35 |
| ALLSHR | 108,600.94 844.23M | 1.00% 1073.54 |
| KSE30 | 53,548.42 162.02M | 0.99% 525.53 |
| KMI30 | 256,725.70 154.74M | 0.76% 1936.43 |
| KMIALLSHR | 70,620.69 563.61M | 0.98% 683.55 |
| BKTi | 48,625.03 36.31M | 1.37% 658.39 |
| OGTi | 37,179.52 8.29M | 0.94% 345.85 |
| Symbol | Bid/Ask | High/Low |
|---|
| Name | Last | High/Low | Chg/%Chg |
|---|---|---|---|
| BITCOIN FUTURES | 60,750.00 | 61,150.00 60,590.00 | 915.00 1.53% |
| BRENT CRUDE | 72.47 | 73.51 72.44 | -1.27 -1.72% |
| RICHARDS BAY COAL MONTHLY | 115.00 | 0.00 0.00 | 0.50 0.44% |
| ROTTERDAM COAL MONTHLY | 126.50 | 126.50 125.90 | 0.50 0.40% |
| USD RBD PALM OLEIN | 1,157.50 | 1,157.50 1,157.50 | 0.00 0.00% |
| CRUDE OIL - WTI | 69.22 | 70.21 69.21 | -1.12 -1.59% |
| SUGAR #11 WORLD | 14.01 | 14.09 13.81 | 0.06 0.43% |
Chart of the Day
Latest News
Top 5 things to watch in this week
Pakistan Stock Movers
| Name | Last | Chg/%Chg |
|---|
| Name | Last | Chg/%Chg |
|---|