Pakistan's exports cross $3bn mark, trade deficit narrows 28.5% in Jan

MG News | February 02, 2026 at 07:51 PM GMT+05:00

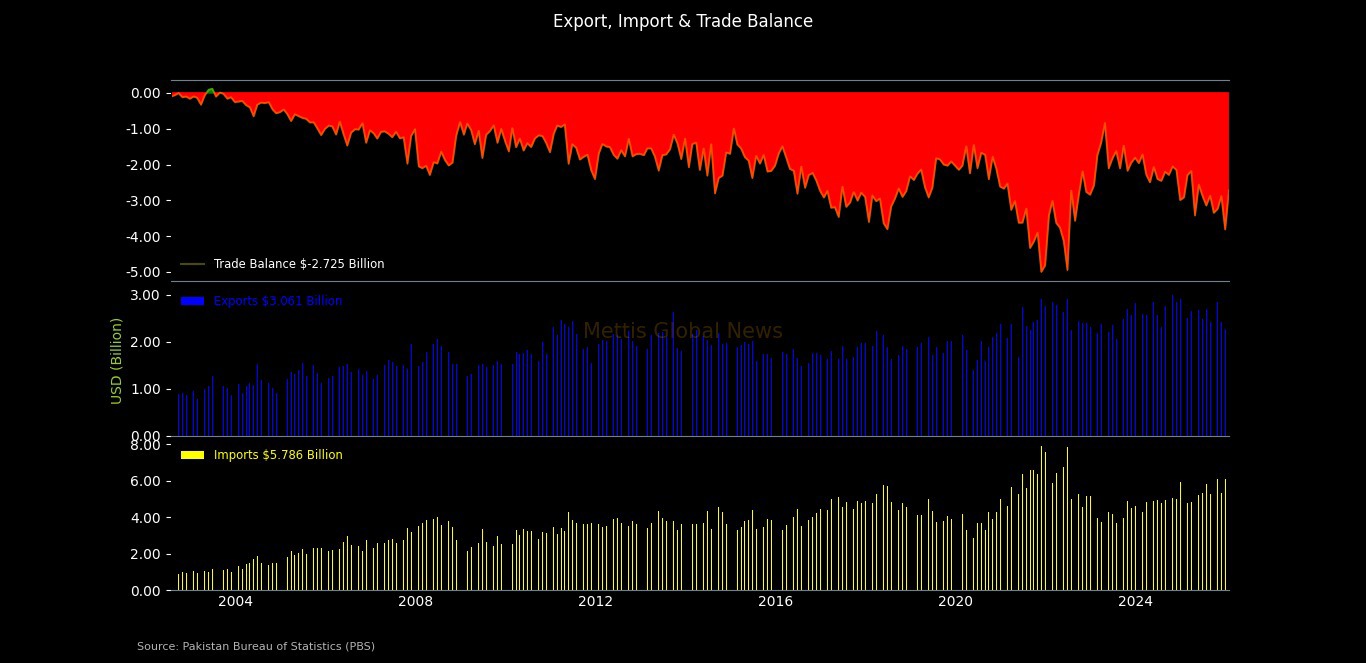
February 02, 2026 (MLN): Pakistan's trade deficit narrowed sharply by
28.53% month-on-month (MoM) to $2.725 billion in January 2026, compared to
$3.813bn in December 2025, as the country achieved a historic milestone with
exports surpassing the $3 billion threshold for the first time.
The improvement was driven by a sharp surge in exports
alongside a significant decline in imports, according to provisional data
released by the Pakistan Bureau of Statistics (PBS).
On a year-on-year (YoY) basis, however, the trade deficit
contracted by only 6.61% from $2.918bn in January 2025, as both exports and
imports showed mixed performance.
Monthly Performance:
Exports in January 2026 surged
to $3.061bn crossing the $3 billion mark for the first time in Pakistan's trade
history registering a strong 34.96% MoM increase compared to December,
signaling a notable recovery in outbound trade.
Imports, meanwhile, declined to $5.786bn, down 4.85% MoM,
helping to significantly narrow the monthly trade gap.
Yearly Performance:
The YoY comparison revealed
modest improvements in Pakistan's external trade position.
Exports increased 3.73% YoY from $2.951bn in January 2025,
while imports decreased by 1.41% YoY from $5.869bn, resulting in a lower trade
deficit of $2.725bn.
Cumulative Trend (July – January FY26):
During the
first seven months of FY26, exports totaled $18.195bn, down 7.09% YoY, while
imports rose 9.42% YoY to $40.233bn.
As a result, the cumulative trade deficit widened
significantly to $22.038bn, marking a 28.22% increase compared to the same
period last year.
Despite the positive monthly performance in January, the data emphasizes ongoing structural challenges for Pakistan's trade sector.
While the month showed encouraging signs with record-breaking exports and
falling imports, the cumulative trend continues to reflect pressure on the
country's balance of payments.
Copyright Mettis Link News
Related News


| Name | Price/Vol | %Chg/NChg |
|---|---|---|
| KSE100 | 180,181.02 331.76M | -1.13% -2060.76 |
| ALLSHR | 109,392.96 764.90M | -1.08% -1190.71 |
| KSE30 | 53,794.18 78.77M | -1.17% -637.53 |
| KMI30 | 253,767.50 98.17M | -1.22% -3146.71 |
| KMIALLSHR | 70,193.61 496.68M | -1.19% -847.70 |
| BKTi | 51,146.84 16.01M | -1.09% -565.92 |
| OGTi | 36,267.66 7.40M | -1.07% -391.92 |
| Symbol | Bid/Ask | High/Low |
|---|
| Name | Last | High/Low | Chg/%Chg |
|---|---|---|---|
| BITCOIN FUTURES | 63,195.00 | 64,680.00 62,605.00 | -890.00 -1.39% |
| BRENT CRUDE | 77.42 | 79.80 77.28 | 1.41 1.86% |
| RICHARDS BAY COAL MONTHLY | 105.75 | 0.00 0.00 | -1.15 -1.08% |
| ROTTERDAM COAL MONTHLY | 118.00 | 0.00 0.00 | 0.65 0.55% |
| USD RBD PALM OLEIN | 1,135.00 | 1,135.00 1,135.00 | 0.00 0.00% |
| CRUDE OIL - WTI | 72.73 | 75.08 72.61 | 1.32 1.85% |
| SUGAR #11 WORLD | 14.73 | 14.98 14.65 | -0.15 -1.01% |
Chart of the Day
Latest News
Top 5 things to watch in this week
Pakistan Stock Movers
| Name | Last | Chg/%Chg |
|---|
| Name | Last | Chg/%Chg |
|---|