
PSX in September
MG News | October 02, 2026 at 10:54 AM GMT+05:00

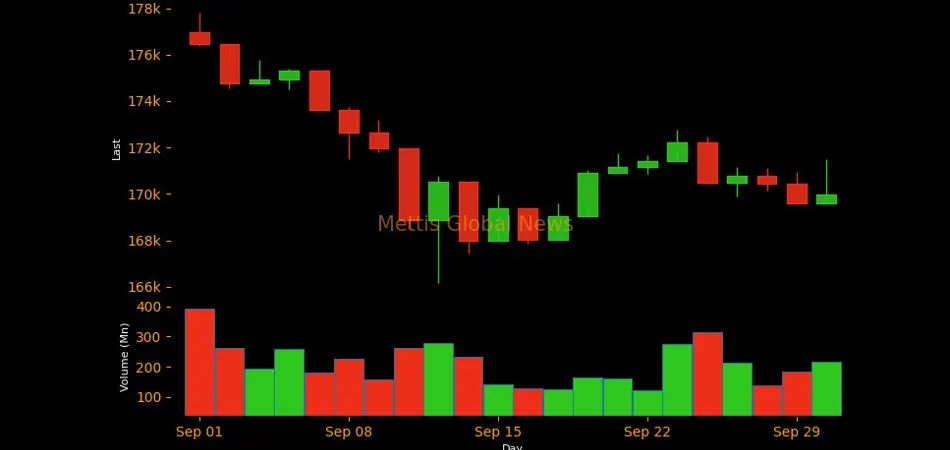
October 02, 2026 (MLN): The KSE-100 Index closed September 2026 on
a weak note, as persistent geopolitical uncertainty and volatile oil prices
kept investors on the defensive, and a heavy unwind in banking stocks turned a
cautious month into the index’s steepest monthly decline since March.
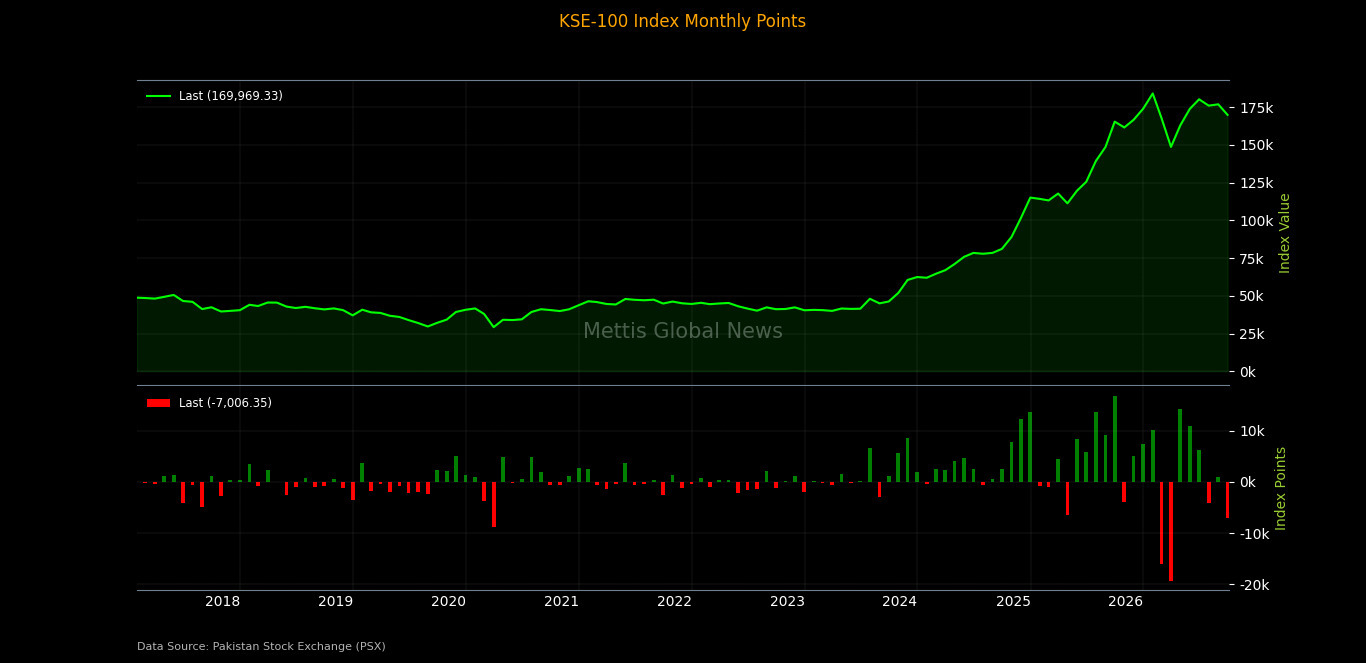
The benchmark index opened the month around the 176,976 mark, its August 2026 close, and slipped through the four weeks to settle at 169,969 points, shedding 7,006 points, or 3.96%, on a month-on-month basis. In doing so, September erased August’s modest 882-point gain nearly eight times over, and pushed the index back below the 170,000 level.
On a year-on-year basis, measured against its September 2025 close of 165,494 points, the KSE-100 is still up 4,476 points, or 2.70%. That figure, however, marks a sharp compression from the 19.1% YoY gain recorded at the end of August and 26.3% at the end of July.
Market Cap
The KSE-100’s market capitalisation
contracted in tandem with the index, falling to PKR 4.780 trillion at the end
of September 2026 from PKR 4.995 trillion in August, a month-on-month decline
of roughly PKR 215.1 billion, or 4.31%.
On a year-on-year basis, against PKR 4.897 trillion recorded in September 2025, market
capitalisation is now down roughly PKR 117.2 billion, or 2.39%, even though the
index itself is 2.70% higher over the same period.
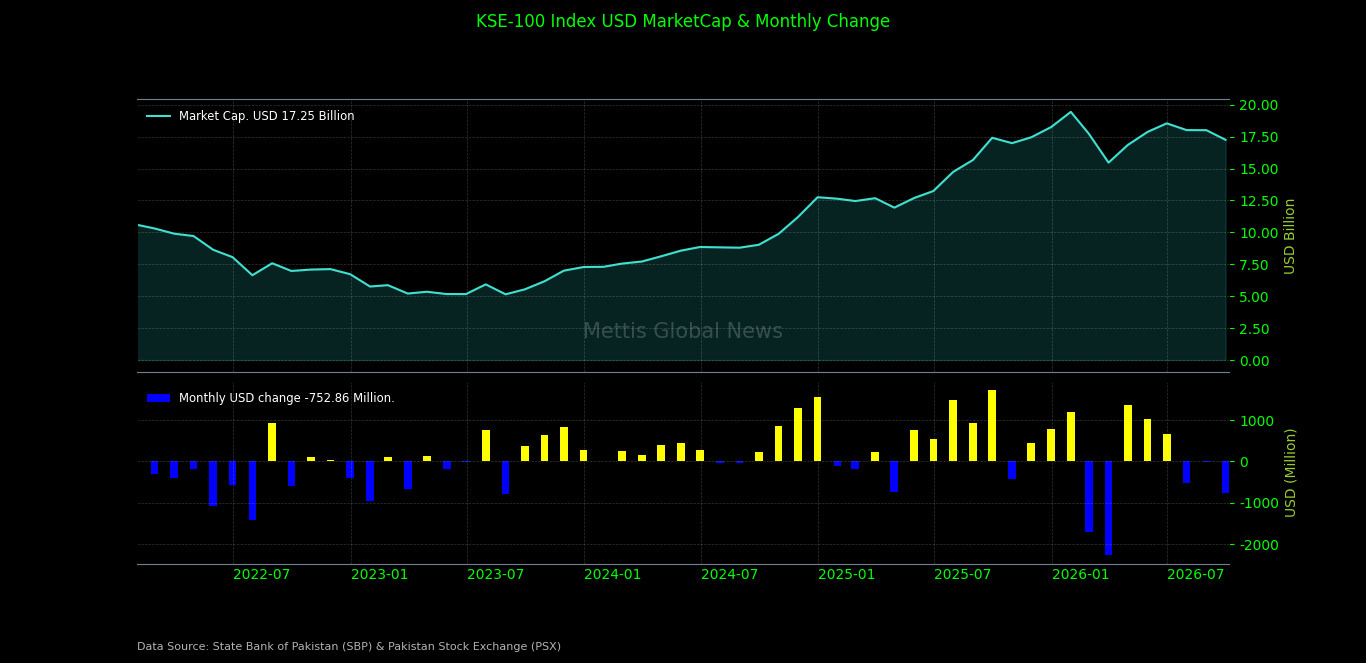
In US dollar terms, the KSE-100’s market
capitalisation stood at approximately $17.25 billion as of September 2026, down
from $1 billion in August, a month-on-month decline of about $752.9
million, or 4.18%. The dollar-denominated decline was marginally softer than
the rupee one, as the PKR firmed slightly against the greenback during the
month, from 277.47 to 277.11.
Compared with September 2025, when
dollar-denominated market capitalisation stood at roughly $17.41 billion, the
current level represents a year-on-year decline of about $159.0 million, or
0.91%. The rupee’s 1.5% appreciation over the twelve months, from PKR
281.32/USD to PKR 277.11/USD, softened the blow for dollar-based holders
compared with the 2.39% fall in rupee terms.
Adjusting for currency movement, the KSE-100
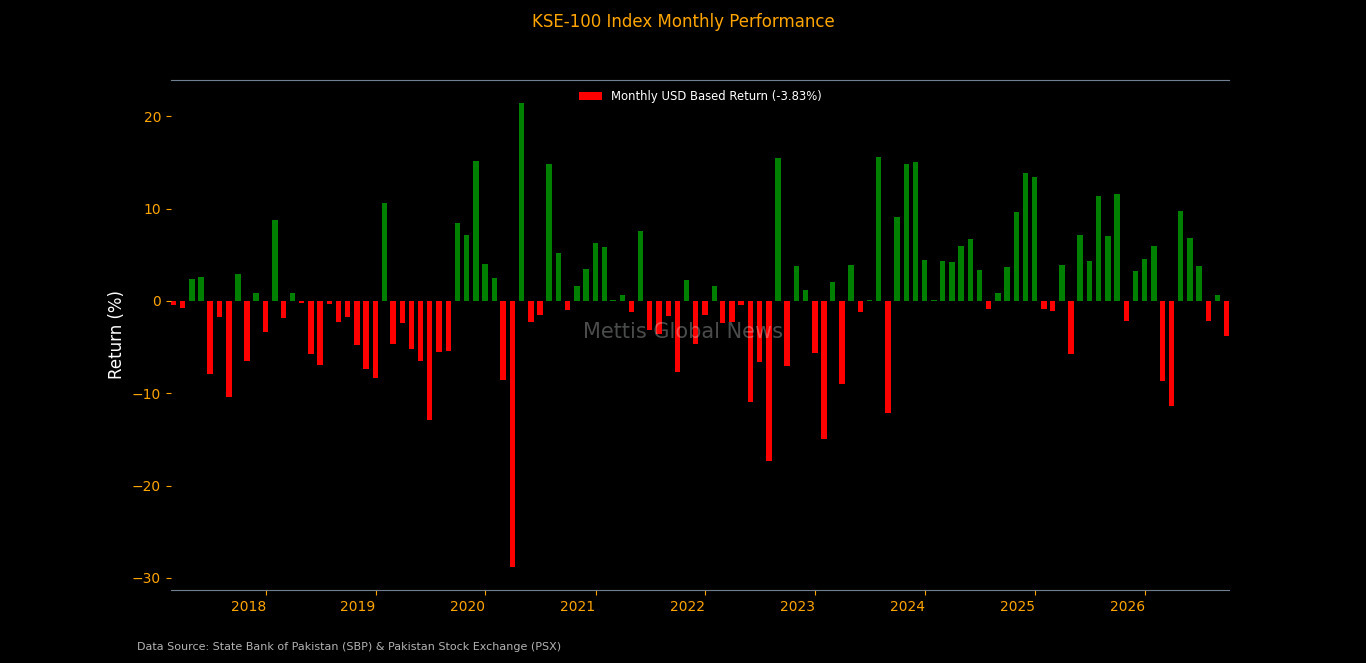
delivered a dollar-denominated return of -3.83% in September 2026, a fraction
better than the PKR-based return of -3.96%, since the rupee appreciated by a
marginal 0.13% over the month. In other words, currency stability meant
dollar-based investors absorbed almost the full extent of the local-currency
decline, with only negligible cushioning from the exchange rate.
September was the index’s weakest USD-based
reading since March’s -11.4%, and the second negative month out of the last
three after July’s -2.2% and August’s barely positive 0.62%. The pattern
underlines how far momentum has cooled since the strong run of April (9.7%),
May (6.8%) and June (3.8%).
On a year-on-year basis, the dollar-denominated return over the twelve months to September 2026 works out to approximately 4.26%, outpacing the local-currency return of 2.70% on the back of the rupee’s steady appreciation.
Economic Backdrop
September’s sell-off is all the more striking because the macro data released during the month were, on balance, constructive. The external account continued to improve. The current account deficit shrank to $98 million in August from $445 million in July and $324 million in August 2025, bringing the 2MFY27 deficit down to $543 million from $853 million in the same period last year.
Workers’ remittances rose 17% YoY to $3.7 billion in August, taking the 2MFY27 total to $7.3 billion, up 15%, while net FDI rose 24% YoY to $494 million in the first two months of the fiscal year.
The reserve position strengthened further.
SBP’s reserves climbed to a record $21.4 billion, lifting import cover to 3.03
months, the highest since August 2020, while total liquid reserves reached
$26.8 billion, the highest since September 2021. The rupee held broadly stable
through the month, trading within a narrow PKR 277.29–277.63/USD band.
Not every indicator pointed the same way. The trade deficit widened 15.1% YoY to $3.3 billion in August, as exports fell 5.2% to $2.5 billion while imports rose 10.6% to $5.8 billion, and the 2MFY27 trade gap is now 20.3% wider at $7.3 billion.
Inflation remains the market’s sore point. Headline CPI for September, released on 1 October, came in at 10.3% YoY, easing from 11.1% in August but well above the 5.8% of September 2025. Price pressures beneath the surface were mixed. Wholesale inflation accelerated to 13.3% YoY and trimmed-mean core measures firmed to 9.4%, even as NFNE core softened.
Against that backdrop, the State Bank kept the policy rate unchanged at 11.5% at its 14 September review, and yields in the latest PIB auction rose by 20–75 basis points across the 3-, 5- and 10-year tenors, with the government raising PKR 178.6 billion against a PKR 250 billion target.
Sector and Scripwise Movers
Sectoral performance was overwhelmingly
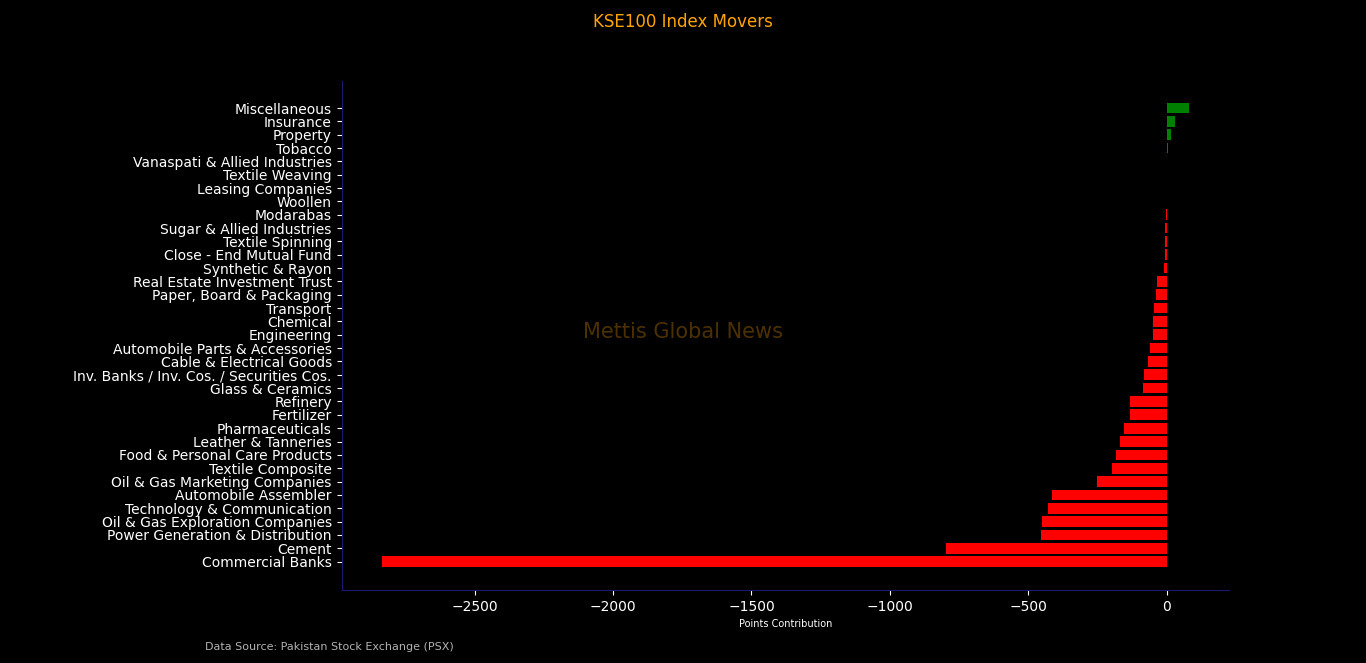
negative in September, with only six of 35 sectors adding points to the index.
Commercial Banks were the biggest drag by a wide margin, wiping out 2,835 points, roughly 40% of the index’s monthly decline. The sector reversed sharply after being the market’s lone heavyweight
saviour in July, when it added nearly 1,700 points.
Cement followed at a distance, shaving 797 points, with Power Generation & Distribution (-453 points), Oil & Gas Exploration Companies (-451 points), Technology & Communication (-428 points) and Automobile Assemblers (-414 points) clustered closely behind.
Oil & Gas Marketing Companies subtracted a further 250 points, while Textile Composite, Food & Personal Care Products, Leather & Tanneries and Pharmaceuticals each detracted between roughly 154 and 197 points.
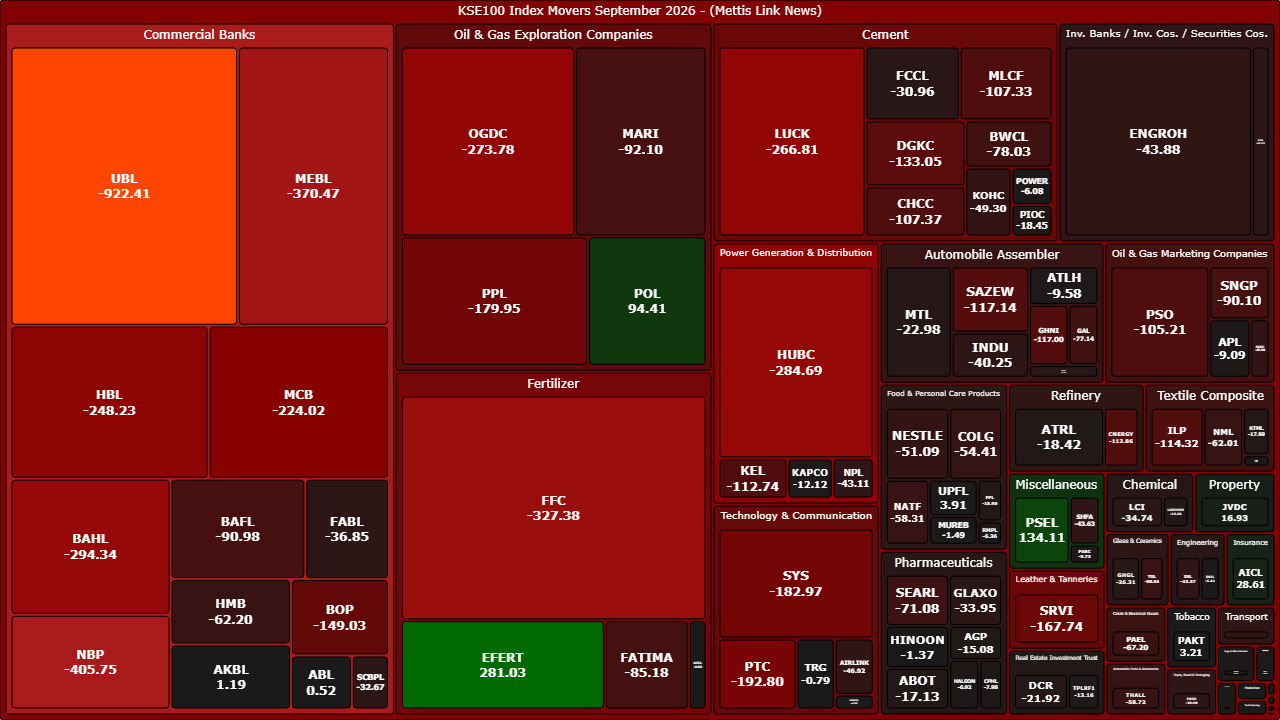
At the individual scrip level, the bank sell-off was led decisively by United Bank Limited, which alone erased 922 points, about 13% of the month’s total decline, extending the 449-point drag it had already inflicted in August. National Bank of Pakistan (-406 points), Meezan Bank (-370 points), Bank Al Habib (-294 points), HBL (-248 points) and MCB Bank (-224 points) compounded the damage, and in all, 11 of the 13 banks in the index closed the month lower.
Outside banking, Fauji Fertilizer (-327
points), Hub Power (-285 points), Oil & Gas Development Company (-274
points) and Lucky Cement (-267 points) were the heaviest drags, followed by
PTCL (-193 points), Systems Limited (-183 points) and Pakistan Petroleum (-180
points).
FIPI/LIPI
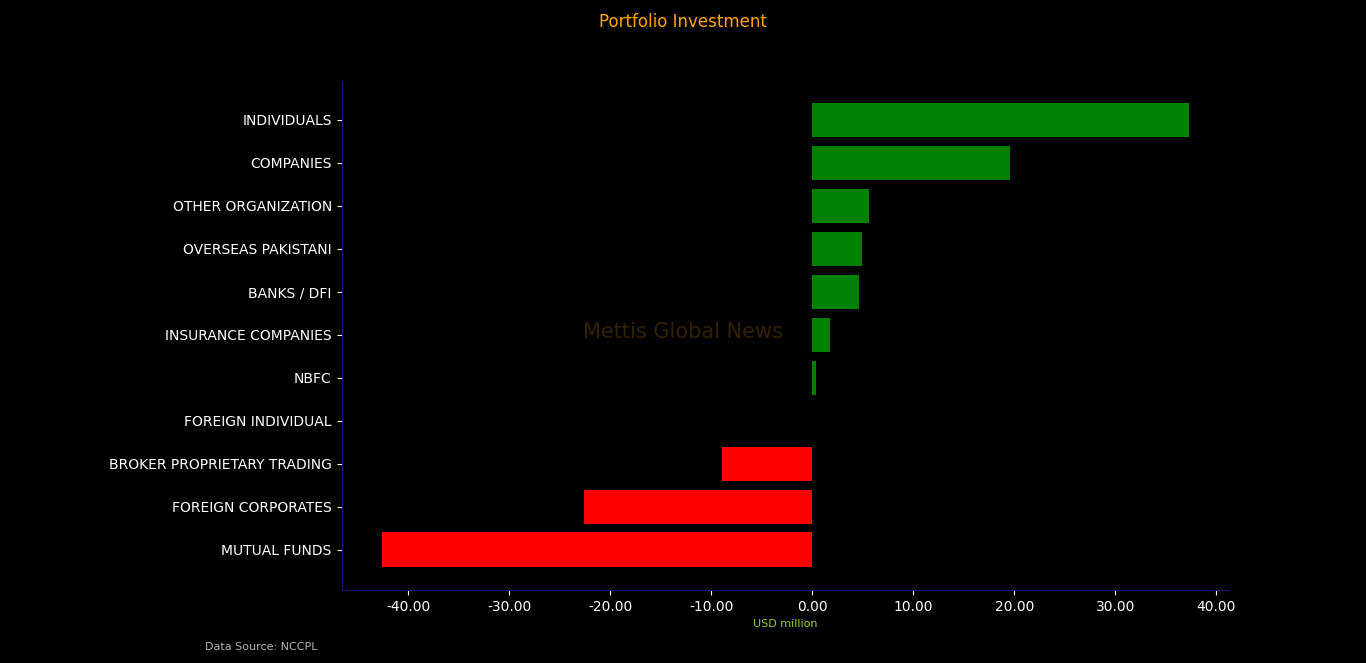
Foreign investors were net sellers of Pakistani equities for the second consecutive month in September, offloading a net $17.70 million (PKR 4.90 billion). Foreign corporates drove the selling with net outflows of $22.57 million, while foreign individuals sold a negligible $45,858. Overseas Pakistanis once again bucked the trend, posting net equity purchases of $4.91 million.
On the debt side, overseas Pakistanis added $335,924, taking the grand total foreign position, equity and debt combined, to a net sale of $17.36 million.
Local investors absorbed the entirety of that selling, with net LIPI equity purchases of $17.70 million. Individual investors were the standout buyers for a third straight month, adding $37.28 million, a figure that has risen every month this quarter, from $23.73 million in July and $31.8 million in August. Companies ($19.55 million), other organisations ($5.66 million), banks and DFIs ($4.62 million) and insurance companies ($1.72 million) also bought.
The counterweight came from mutual funds, which were the month’s largest net sellers of equities at $42.60 million, their heaviest selling of the quarter, with broker proprietary books trimming a further $8.90 million. Strikingly, the same mutual funds were net buyers of $90.37 million in the debt segment. Banks and DFIs moved the other way in debt, selling a net $113.99 million.
Quarterly Review Q1FY27
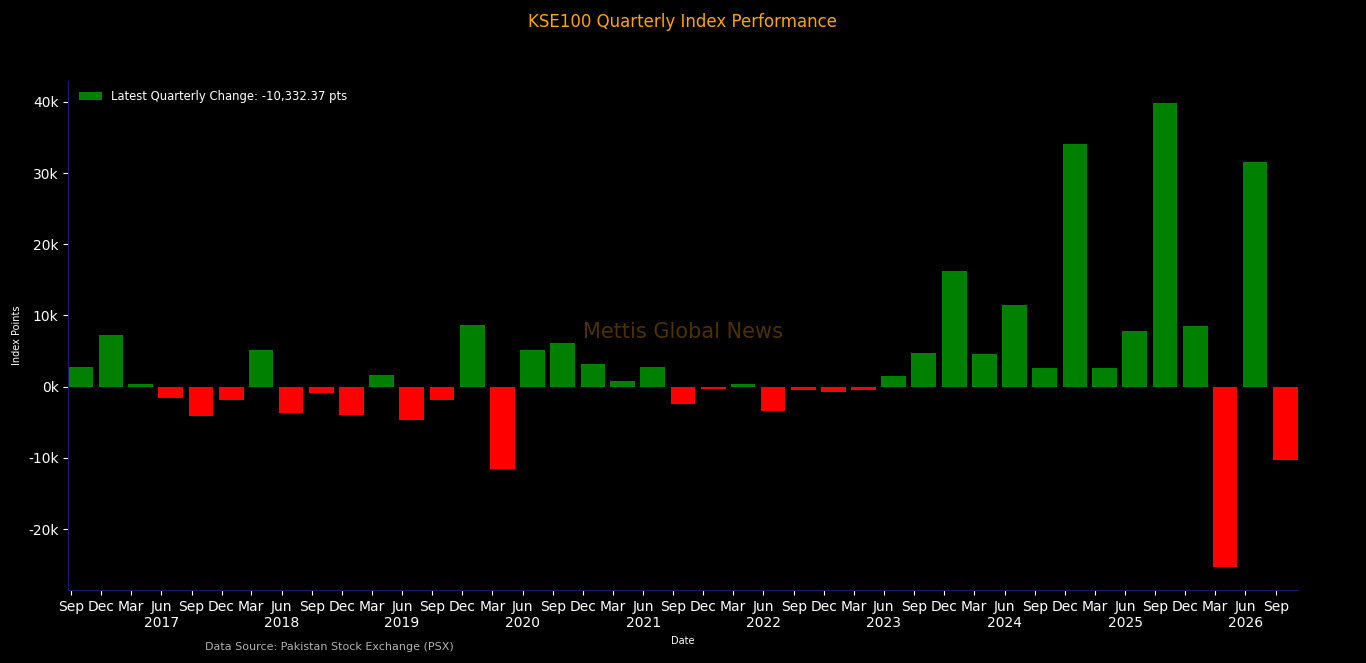
September’s slide sealed a disappointing first quarter for FY27. The KSE-100 began the quarter at 180,302 points, its June 2026 close, and ended it at 169,969 points, a net loss of 10,332 points, or 5.73%.
September alone accounted for roughly two-thirds of that decline, with July contributing a 4,208-point loss (-2.33%) and August offering only a brief 882-point (+0.50%) respite in between.
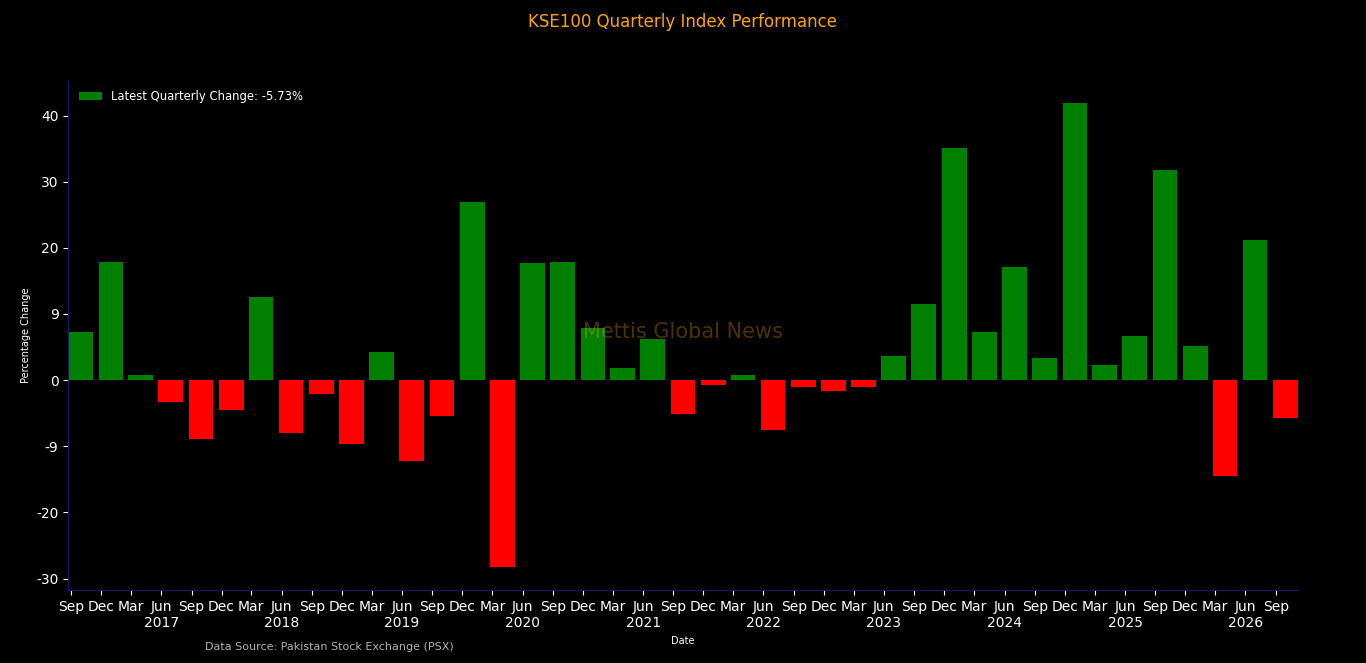
Q4FY26 had delivered a 31,558-point, or 21.2%, rebound from the March sell-off, and Q1FY27 has now handed back roughly a third of those gains. The comparison with the same quarter a year earlier is even more striking: Q1FY26 produced a 39,866-point, or 31.7%, surge, the largest quarterly point gain in the index’s recent history.
Measured in percentage terms, Q1FY27 is the weakest July–September quarter since Q1FY18, when the index fell 8.9%, and the first negative first quarter since FY23. It is also the second losing quarter out of the last three, after the 14.5% plunge of Q3FY26.
Market capitalisation in rupee terms noted that the KSE-100’s market value fell from PKR 5.157 trillion at the end of June to PKR 4.780 trillion at the end of September, a quarterly erosion of roughly PKR 376.7 billion, or 7.31%.
In dollar terms it slipped from $18.54 billion to $17.25 billion, a loss of about $1.29 billion, or 6.96%, while the index’s USD-based return for the quarter came to -5.37%, marginally better than the rupee return as the PKR firmed from 278.16 to 277.11 per dollar.
Looking ahead, October brings a crowded calendar that will help decide whether Q2FY27 brings a recovery or more of the same. The September-quarter results season will test whether the earnings momentum index companies built in FY26 can hold up.
Beyond earnings, the ongoing IMF review remains a key driver of sentiment, and the Monetary Policy Committee meets on 26 October with inflation back above 10%.
Copyright Mettis Link News
Related News



| Name | Price/Vol | %Chg/NChg |
|---|---|---|
| KSE100 | 163,924.32 118.89M | -1.21% -2006.67 |
| ALLSHR | 99,526.88 364.30M | -1.08% -1083.61 |
| KSE30 | 48,313.81 50.96M | -1.53% -750.07 |
| KMI30 | 235,637.18 55.46M | -1.36% -3247.37 |
| KMIALLSHR | 64,683.09 191.88M | -0.90% -587.30 |
| BKTi | 45,181.21 14.21M | -1.56% -715.82 |
| OGTi | 33,395.61 3.57M | -0.82% -277.39 |
| Symbol | Bid/Ask | High/Low |
|---|
| Name | Last | High/Low | Chg/%Chg |
|---|---|---|---|
| BITCOIN FUTURES | 81,105.00 | 84,945.00 80,845.00 | -3510.00 -4.15% |
| BRENT CRUDE | 112.86 | 113.40 109.81 | 4.04 3.71% |
| RICHARDS BAY COAL MONTHLY | 128.50 | 0.00 0.00 | -1.55 -1.19% |
| ROTTERDAM COAL MONTHLY | 147.10 | 0.00 0.00 | 1.80 1.24% |
| USD RBD PALM OLEIN | 1,167.50 | 1,167.50 1,167.50 | 0.00 0.00% |
| CRUDE OIL - WTI | 99.29 | 100.17 97.72 | 2.14 2.20% |
| SUGAR #11 WORLD | 20.13 | 20.64 20.10 | -0.32 -1.56% |
Chart of the Day
Latest News
Top 5 things to watch in this week
 Repatriation of Profit and Dividend
Pakistan Stock Movers
| Name | Last | Chg/%Chg |
|---|
| Name | Last | Chg/%Chg |
|---|