Tech Beat: Cement stocks show potential
.jpg?width=950&height=450&format=Webp)
Abdur Rahman | March 31, 2024 at 10:00 AM GMT+05:00

March 31, 2024 (MLN): The cement sector, while trailing behind the broader market since the June-end rally, shows potential signs of resilience.
Despite a gain of only 35.9% compared to the KSE-100’s impressive 61.6% surge this fiscal year, strong companies have started to pick up their pace.
The cement sector index last tested the one-day 200 exponential moving average (1D 200EMA) in September 2023, which proved to be a critical level, as mentioned earlier.
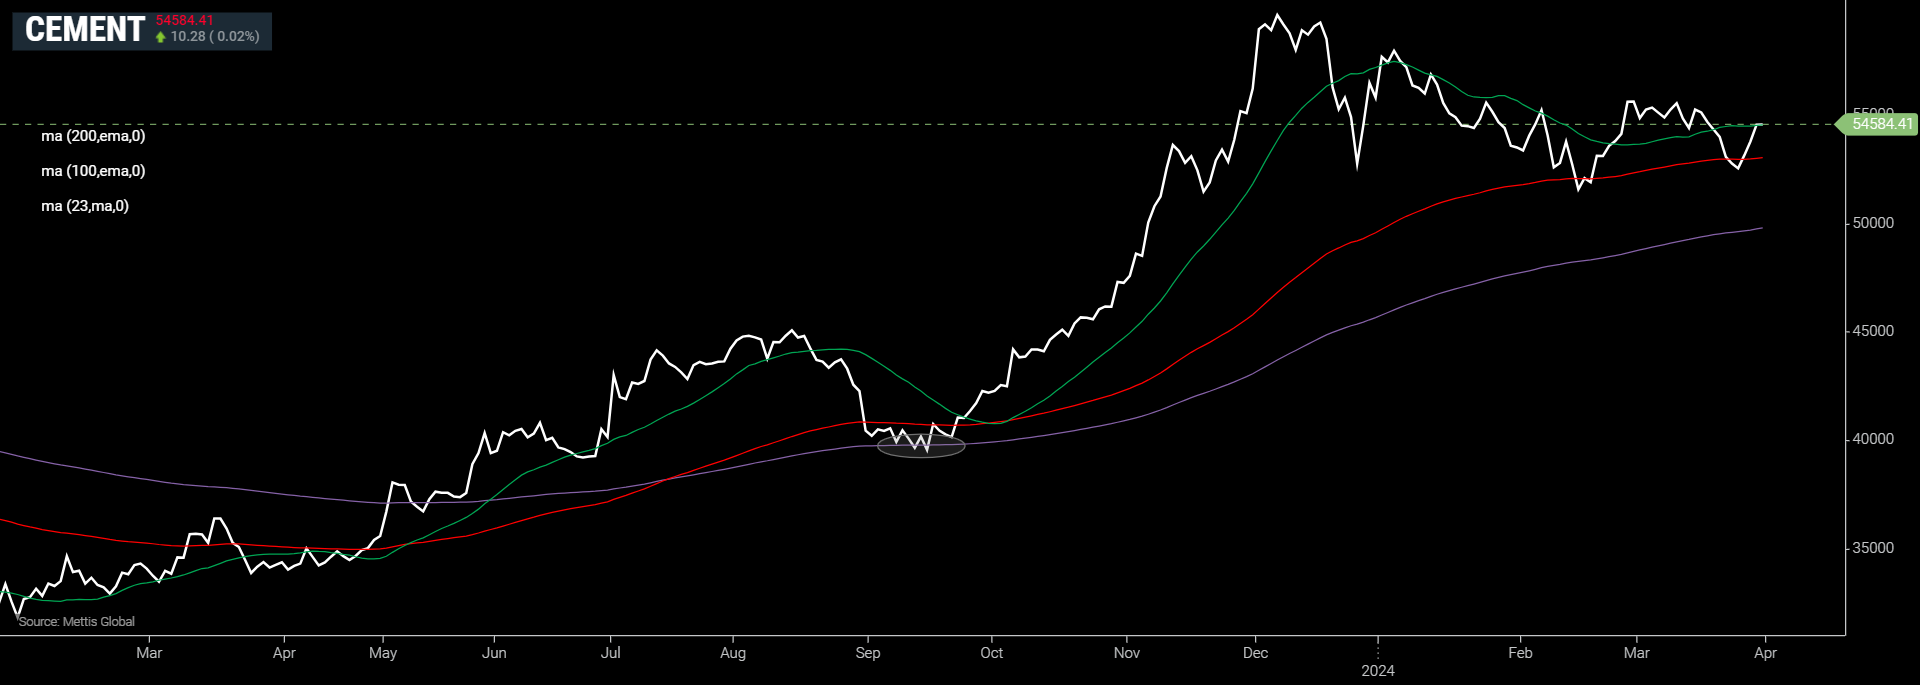
It then trended upwards in tandem with the broader market before hitting brakes around mid-December.
It has traded sideways since then and has found strong support around the 1D 100EMA.
The cement sector index closed at about 54,500 on Friday, which is a strong resistance. Clearing this zone would open the way for testing new fiscal year-to-date (FYTD) highs.
Strong Scrips
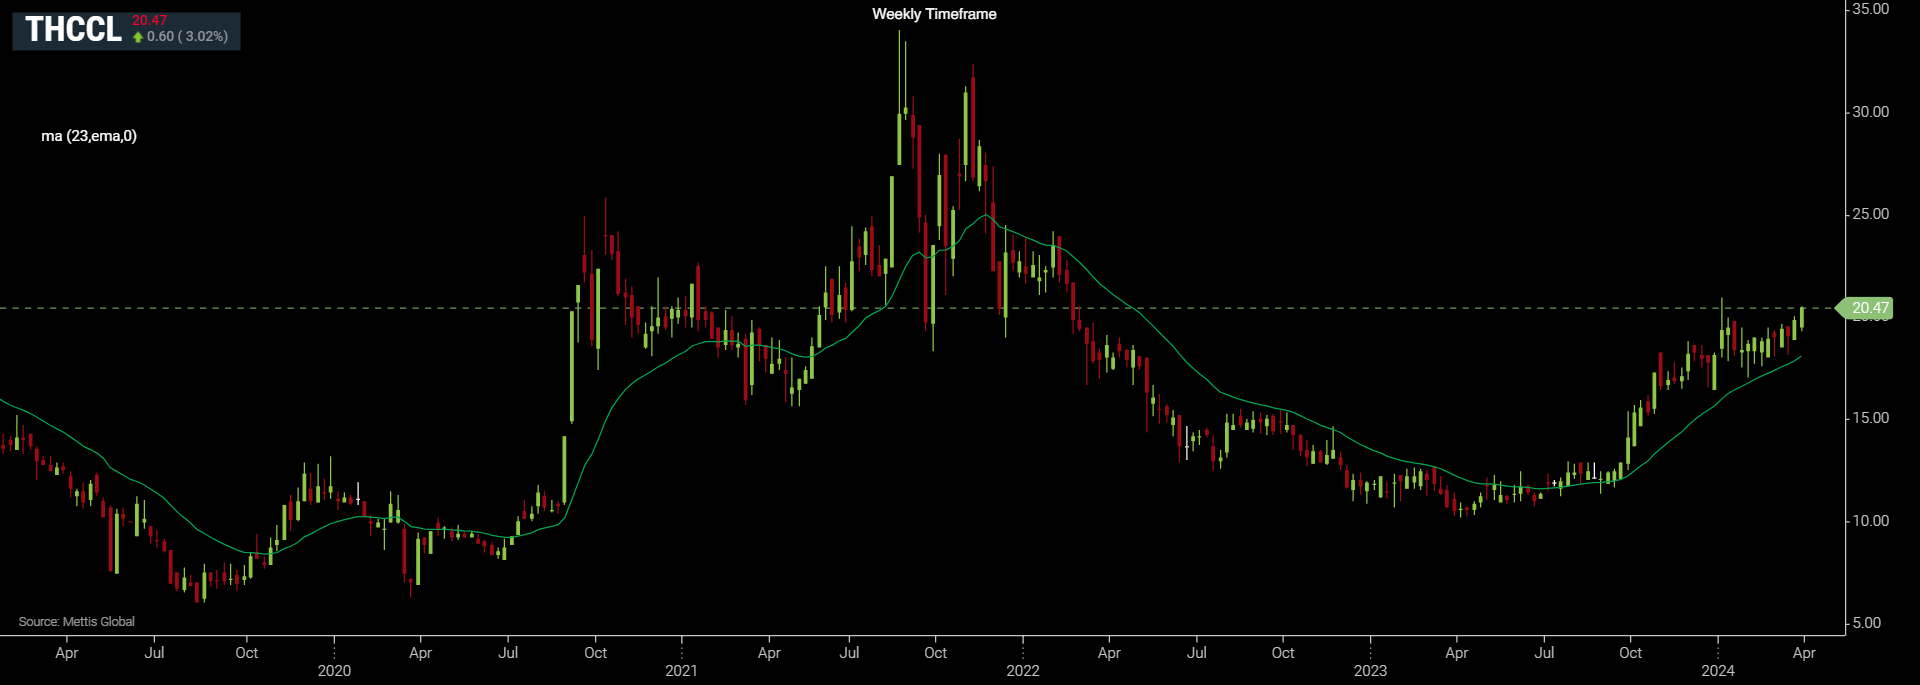
THCCL stands out as one of the strongest stocks. Its sideways movement since November 2023 hints at an accumulation phase, potentially setting the stage for strong expansion upon breaking above Rs21.
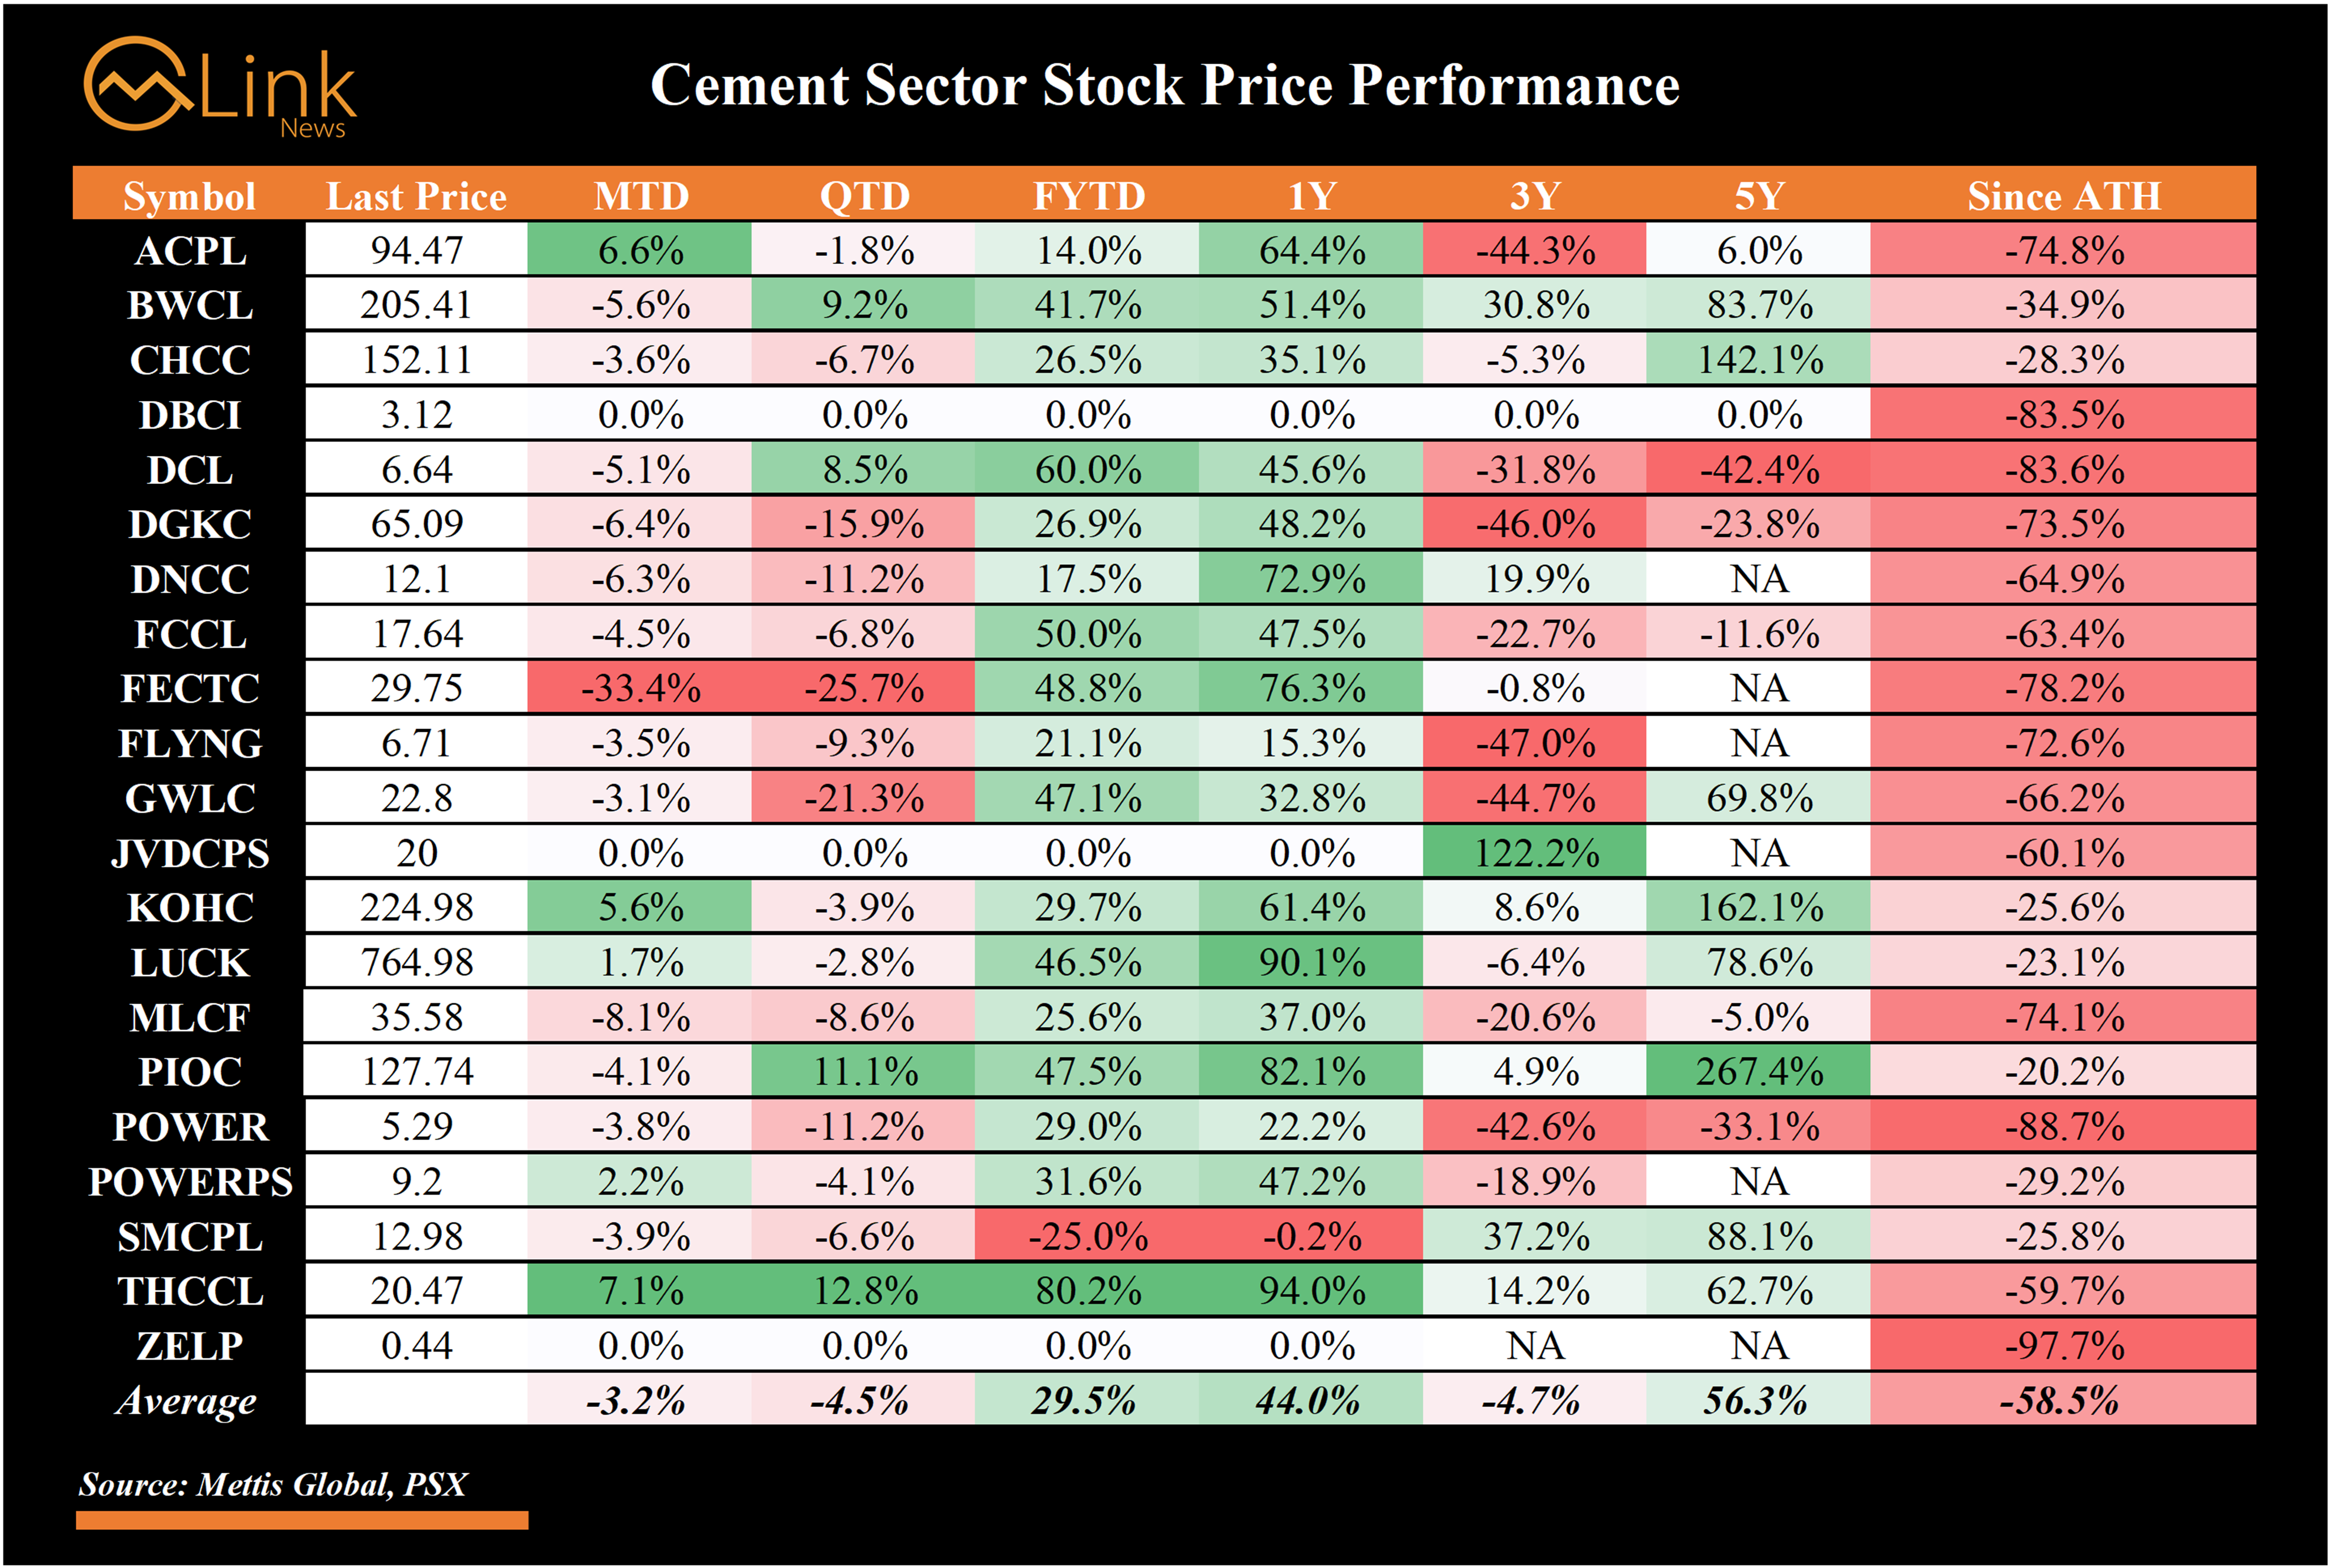
The stock price gained 7.1% in March, 12.8% this quarter, and 80.2% FYTD.
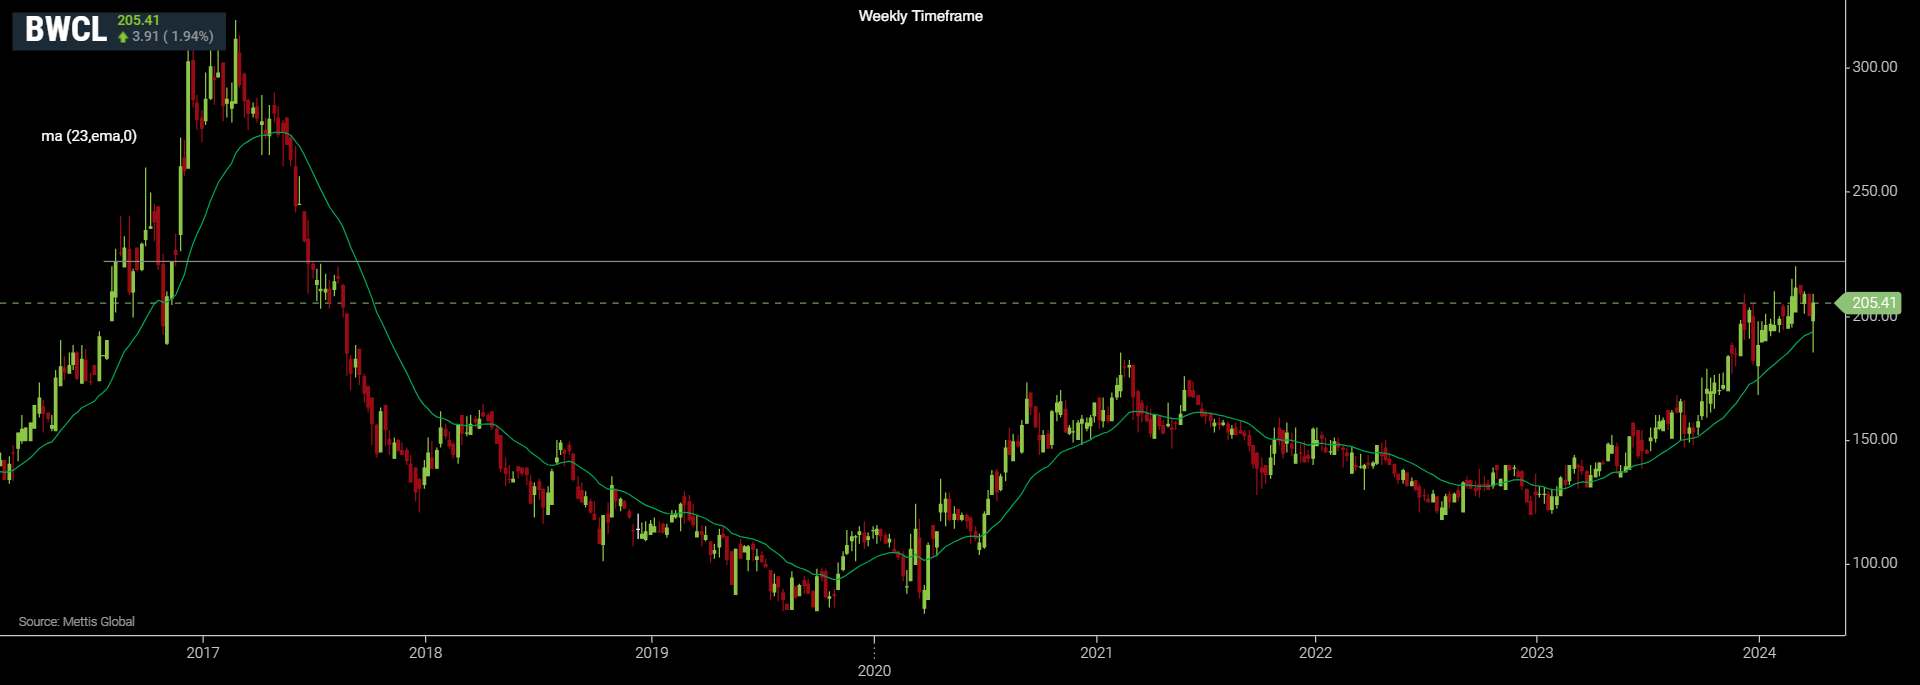
BWCL also stands as a very strong pick in the sector. On a weekly timeframe, aggressive buying during two retests of the 23EMA signals investor confidence.
Bullish aggression seen last week makes an ideal room for another retest of Rs222.7. This level stands as a strong resistance level, and a break above this will open the room for further expansion.
The stock price fell 5.6% in March but is up 9.2% QTD and 41.7% FYTD.
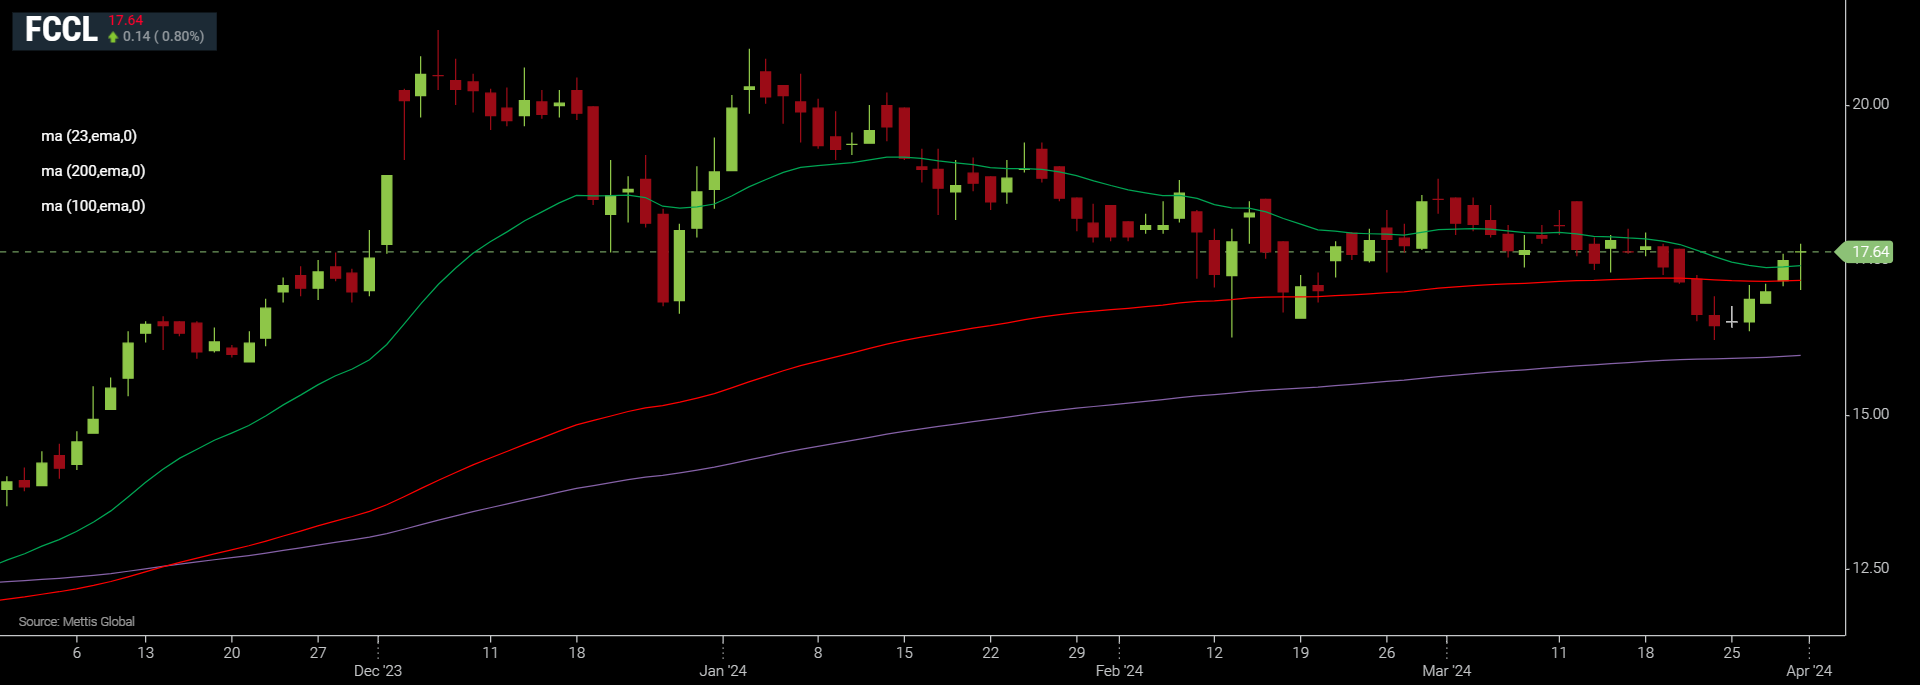
FCCL: A Laggard with Potential
While FCCL has lagged behind, recent bullish activity offers hope. The stock closed above short-term resistance level on Friday, indicating a potential turnaround.
Multiple successful defenses of the Rs16.7 level hint at bottom formation. A retest of Rs18.9 appears likely, and a breakout beyond this level would open significant room for expansion.
Broader Market
The benchmark KSE-100 Index sailed past its record high this week after a period of about 3.5 months. The 67,000 level would now act as strong support, which was also the December high.
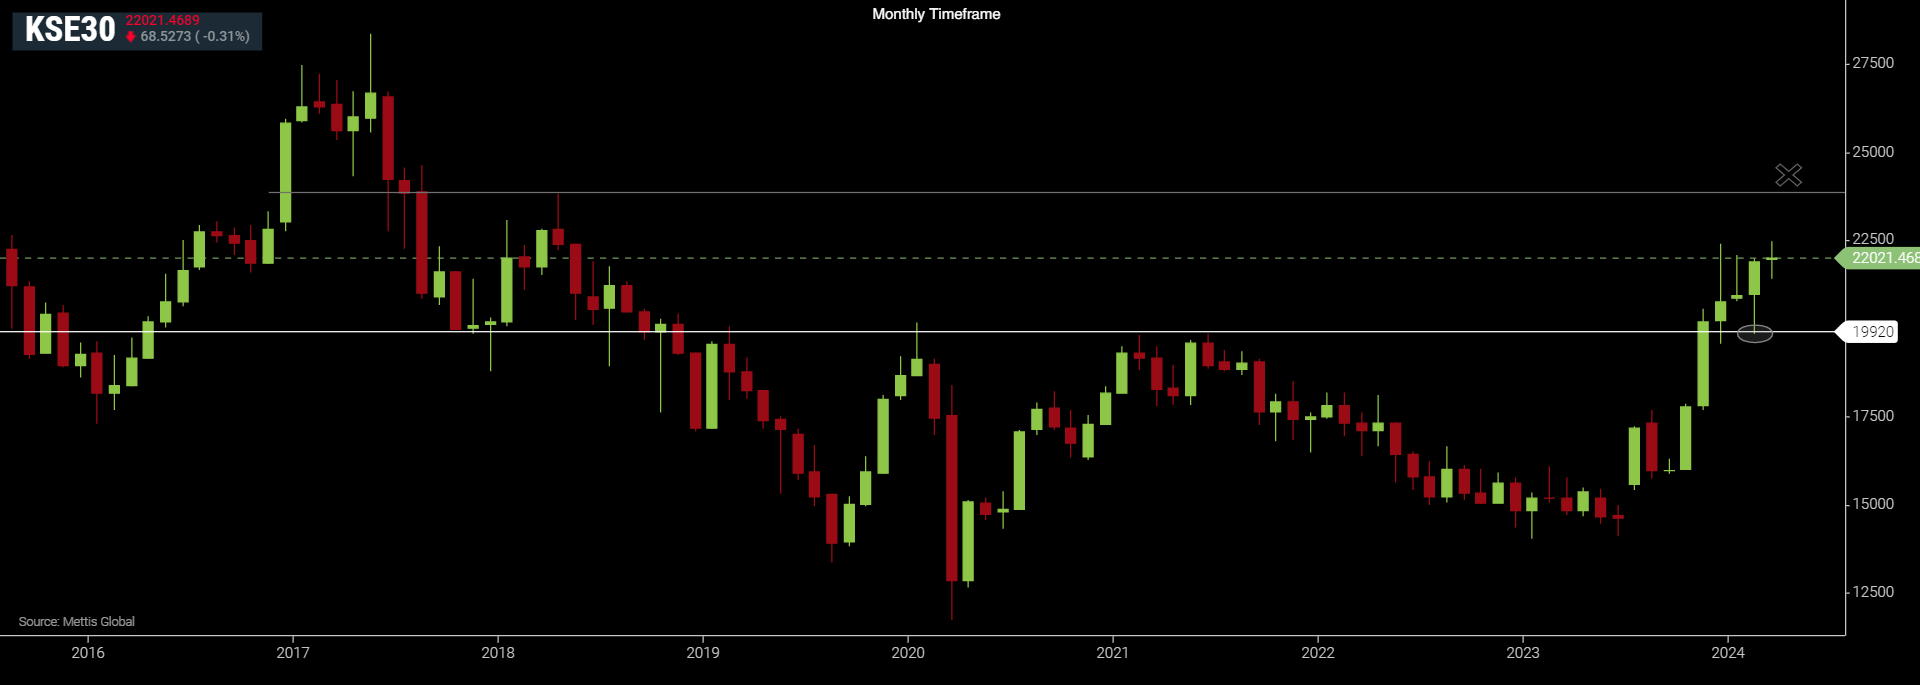
Looking at KSE-30 index, it retraced towards the mentioned 20,000 level in mid-February, which offered an attractive entry point for the sidelined capital.
Based on chart formation, the index is likely to test the next major resistance of 24,000 in the next few months.
Disclaimer: The views and analysis in this article are the opinions of the author and are for informational purposes only. It is not intended to be financial or investment advice and should not be the basis for making financial decisions.
Copyright Mettis Link News
Related News


| Name | Price/Vol | %Chg/NChg |
|---|---|---|
| KSE100 | 175,802.79 267.06M | -1.30% -2320.78 |
| ALLSHR | 106,568.29 617.78M | -1.25% -1352.24 |
| KSE30 | 52,497.68 83.82M | -1.25% -665.92 |
| KMI30 | 247,323.37 106.69M | -1.37% -3422.76 |
| KMIALLSHR | 68,315.26 363.70M | -1.37% -952.13 |
| BKTi | 49,936.11 23.35M | -1.18% -594.28 |
| OGTi | 34,758.02 9.23M | -1.71% -605.59 |
| Symbol | Bid/Ask | High/Low |
|---|
| Name | Last | High/Low | Chg/%Chg |
|---|---|---|---|
| BITCOIN FUTURES | 64,950.00 | 64,970.00 63,980.00 | 680.00 1.06% |
| BRENT CRUDE | 88.26 | 88.38 83.71 | 4.03 4.78% |
| RICHARDS BAY COAL MONTHLY | 105.75 | 0.00 0.00 | -0.65 -0.61% |
| ROTTERDAM COAL MONTHLY | 119.80 | 120.30 119.80 | 0.00 0.00% |
| USD RBD PALM OLEIN | 1,135.00 | 1,135.00 1,135.00 | 0.00 0.00% |
| CRUDE OIL - WTI | 81.77 | 82.07 77.93 | 3.49 4.46% |
| SUGAR #11 WORLD | 14.82 | 14.94 14.39 | 0.38 2.63% |
Chart of the Day
Latest News
Top 5 things to watch in this week
Pakistan Stock Movers
| Name | Last | Chg/%Chg |
|---|
| Name | Last | Chg/%Chg |
|---|