Pakistan's GDP grows 2.09% in Q3 FY24

MG News | May 21, 2024 at 12:11 PM GMT+05:00

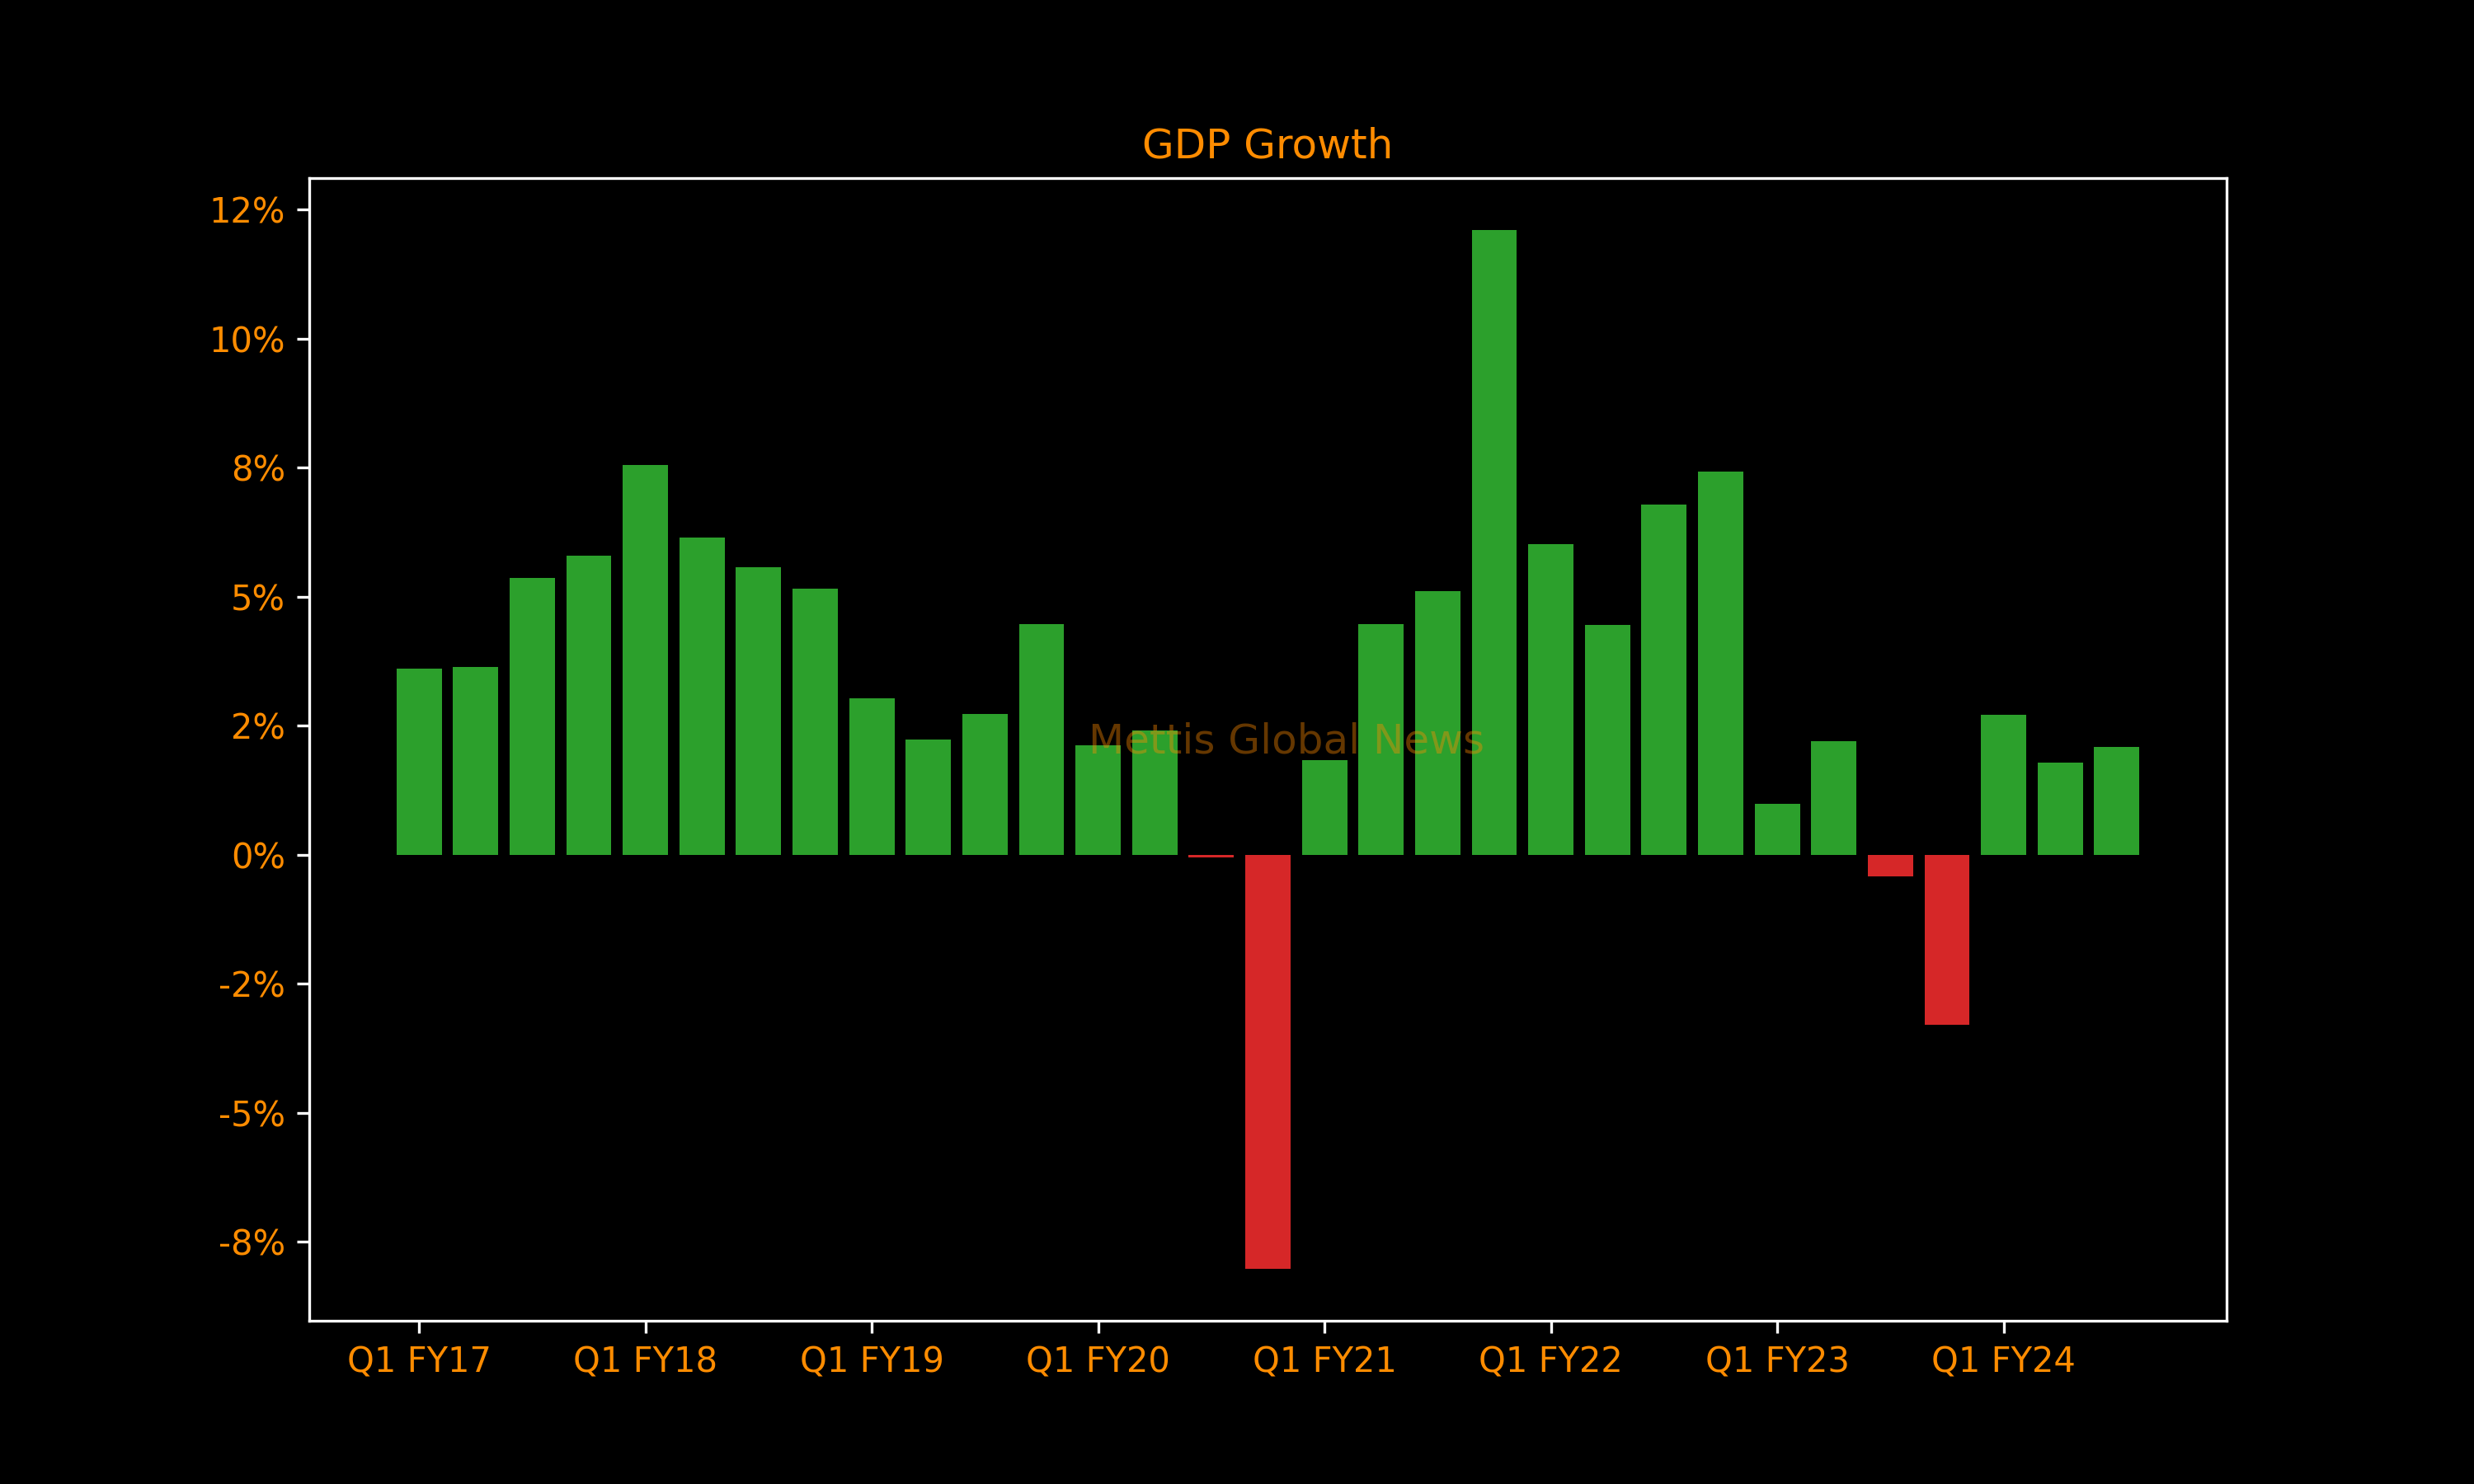
May 21, 2024 (MLN): Pakistan’s Gross Domestic Product (GDP) has shown a growth of 2.09% in Q3 FY24 as compared to the revised growth of 1.79% in the previous quarter, estimates released by the Pakistan Bureau of Statistics (PBS) showed on Tuesday.
Moreover, the growth rate for Q1 has also been revised upwards to 2.71% as compared to 2.50% presented in 108th meeting of the NAC.
The NAC also approved a provisional growth rate of GDP for FY 2023-24 at 2.38%.
These estimates were approved in the 109th National Accounts Committee (NAC) meeting held on the same day.
The growth in agriculture, industry, and services stands at 3.94%, 3.84%, and 0.83% respectively.
During Q3, all the constituents of agriculture have contributed positively e.g. important crops (2.89% due to wheat), other crops (1.14%), cotton ginning (61.75%), and livestock (4.20%).
Despite negative growth of construction industry (-15.75%), the industrial growth of 3.84% is attributable to mining & quarrying (0.63), large-scale manufacturing (1.47%), and electricity, gas, and water supply (37.3%).
The overall growth in services is positive (0.83%) during Q3 2023-24 albeit having mixed trends in its constituents i.e. wholesale & retail trade (0.38%), transport& storage (0.91%), information and communication (-5.92%), finance & insurance activities (-7.11%), public administration and social security (-6.38%) and education (10.38%).
Cumulative Growth FY24
The committee approved the provisional growth of GDP at 2.38% during on-going FY 2023-24.
The provisional growth in agriculture is 6.25%, whereas it is 1.21% for both industry as well as services.
Agriculture
The healthy growth of agriculture is mainly due to double-digit growth in important crops i.e. 16.82% on back of bumper crops of wheat (11.64% from 28.16 to 31.44 MT), cotton (108.22% from 4.91 to 10.22 million bales) and rice (34.78% from 7.32 to 9.87m tons).
Two important crops i.e. sugarcane (-0.39% from 87.98 to 87.64m tons) and maize (-10.35% from 10.99 to 9.85m tons) have posted negative growth.
Further, provisional growth in other crops is 0.90%, cotton ginning & miscellaneous component 47.23%, livestock 3.89% and forestry 3.05%.
Industry
Industry in FY24 has shown a growth of 1.21% provisionally.
Mining & quarrying industry has witnessed a growth of 4.85% because of increase in production of crude oil (1.51%), coal (37.72%), other minerals (7.57%) e.g. limestone (7.95%), marble (23.22%).
Large scale manufacturing, which is based on Quantum Index of Manufacturing (QIM), has witnessed a nominal growth of 0.07% with mixed trend in the production of various groups e.g. Food (+1.69%), Beverages (-3.43%), Textile (-8.27%), Tobacco (-33.59%), Non-metallic mineral products (-3.89%), Wood (+12.09%), Coke & Petroleum (+4.85%), and Pharmaceuticals (+23.19%).
Electricity, gas and water supply industry has shown a negative growth of 10.55% because of decrease in subsidies in real terms due to high deflator.
Construction industry increased by 5.86% due to increase in construction-related expenditures by private and public sector enterprise.
Services
Services industry has also shown a growth of 1.21% in FY24.
Detailed analysis of the industry reflects a mixed trend.
Wholesale and retail trade has witnessed a growth of 0.32% because of positive growth in agriculture output.
Transport and storage industry has increased by 1.19% because of increase in output of railways, water transport, and road transport.
Due to high inflation, real growth in Information & Communication, Finance & Insurance and Public Administration and Social Security industries has become negative at 3.02%, 9.64% and 5.25% respectively.
Further, both Education and Human health and Social Work industries have posted positive growth at 10.30% and 6.80% respectively.
Other private services have been estimated at 3.58% on the basis of indicators received from the sources.
Copyright Mettis Link News
Related News


| Name | Price/Vol | %Chg/NChg |
|---|---|---|
| KSE100 | 171,021.20 228.53M | -0.42% -718.25 |
| ALLSHR | 103,836.39 572.65M | -0.41% -422.85 |
| KSE30 | 50,951.99 89.47M | -0.52% -264.77 |
| KMI30 | 240,633.87 93.99M | -0.31% -756.80 |
| KMIALLSHR | 66,572.75 300.61M | -0.28% -185.59 |
| BKTi | 48,673.23 31.18M | -0.70% -343.86 |
| OGTi | 33,702.25 6.35M | -0.61% -205.57 |
| Symbol | Bid/Ask | High/Low |
|---|
| Name | Last | High/Low | Chg/%Chg |
|---|---|---|---|
| BITCOIN FUTURES | 64,130.00 | 65,895.00 63,680.00 | -725.00 -1.12% |
| BRENT CRUDE | 96.82 | 101.19 95.13 | -3.87 -3.84% |
| RICHARDS BAY COAL MONTHLY | 105.75 | 0.00 0.00 | -1.55 -1.44% |
| ROTTERDAM COAL MONTHLY | 121.10 | 121.10 121.10 | 0.70 0.58% |
| USD RBD PALM OLEIN | 1,175.00 | 1,175.00 1,175.00 | 0.00 0.00% |
| CRUDE OIL - WTI | 89.33 | 92.83 87.68 | -2.86 -3.10% |
| SUGAR #11 WORLD | 14.76 | 14.79 14.54 | 0.07 0.48% |
Chart of the Day
Latest News
Top 5 things to watch in this week
Pakistan Stock Movers
| Name | Last | Chg/%Chg |
|---|
| Name | Last | Chg/%Chg |
|---|