LSMI output decreases by 4.14% MoM in February

MG News | April 16, 2024 at 05:53 PM GMT+05:00

April 16, 2024 (MLN): Pakistan’s Large Scale Manufacturing Industries (LSMI) production decreased by 4.14% MoM in February 2024 with the index at 126.01 compared to 131.45 in January 2024, the Pakistan Bureau of Statistics (PBS) reported today.
On the other hand, on a yearly basis, the LSMI output witnessed a slight rise of 0.06% YoY against 125.93 recorded in February 2023.
Cumulatively in 8MFY24, LSMI has shown a negative growth of 0.51% when compared with the same period of last year.
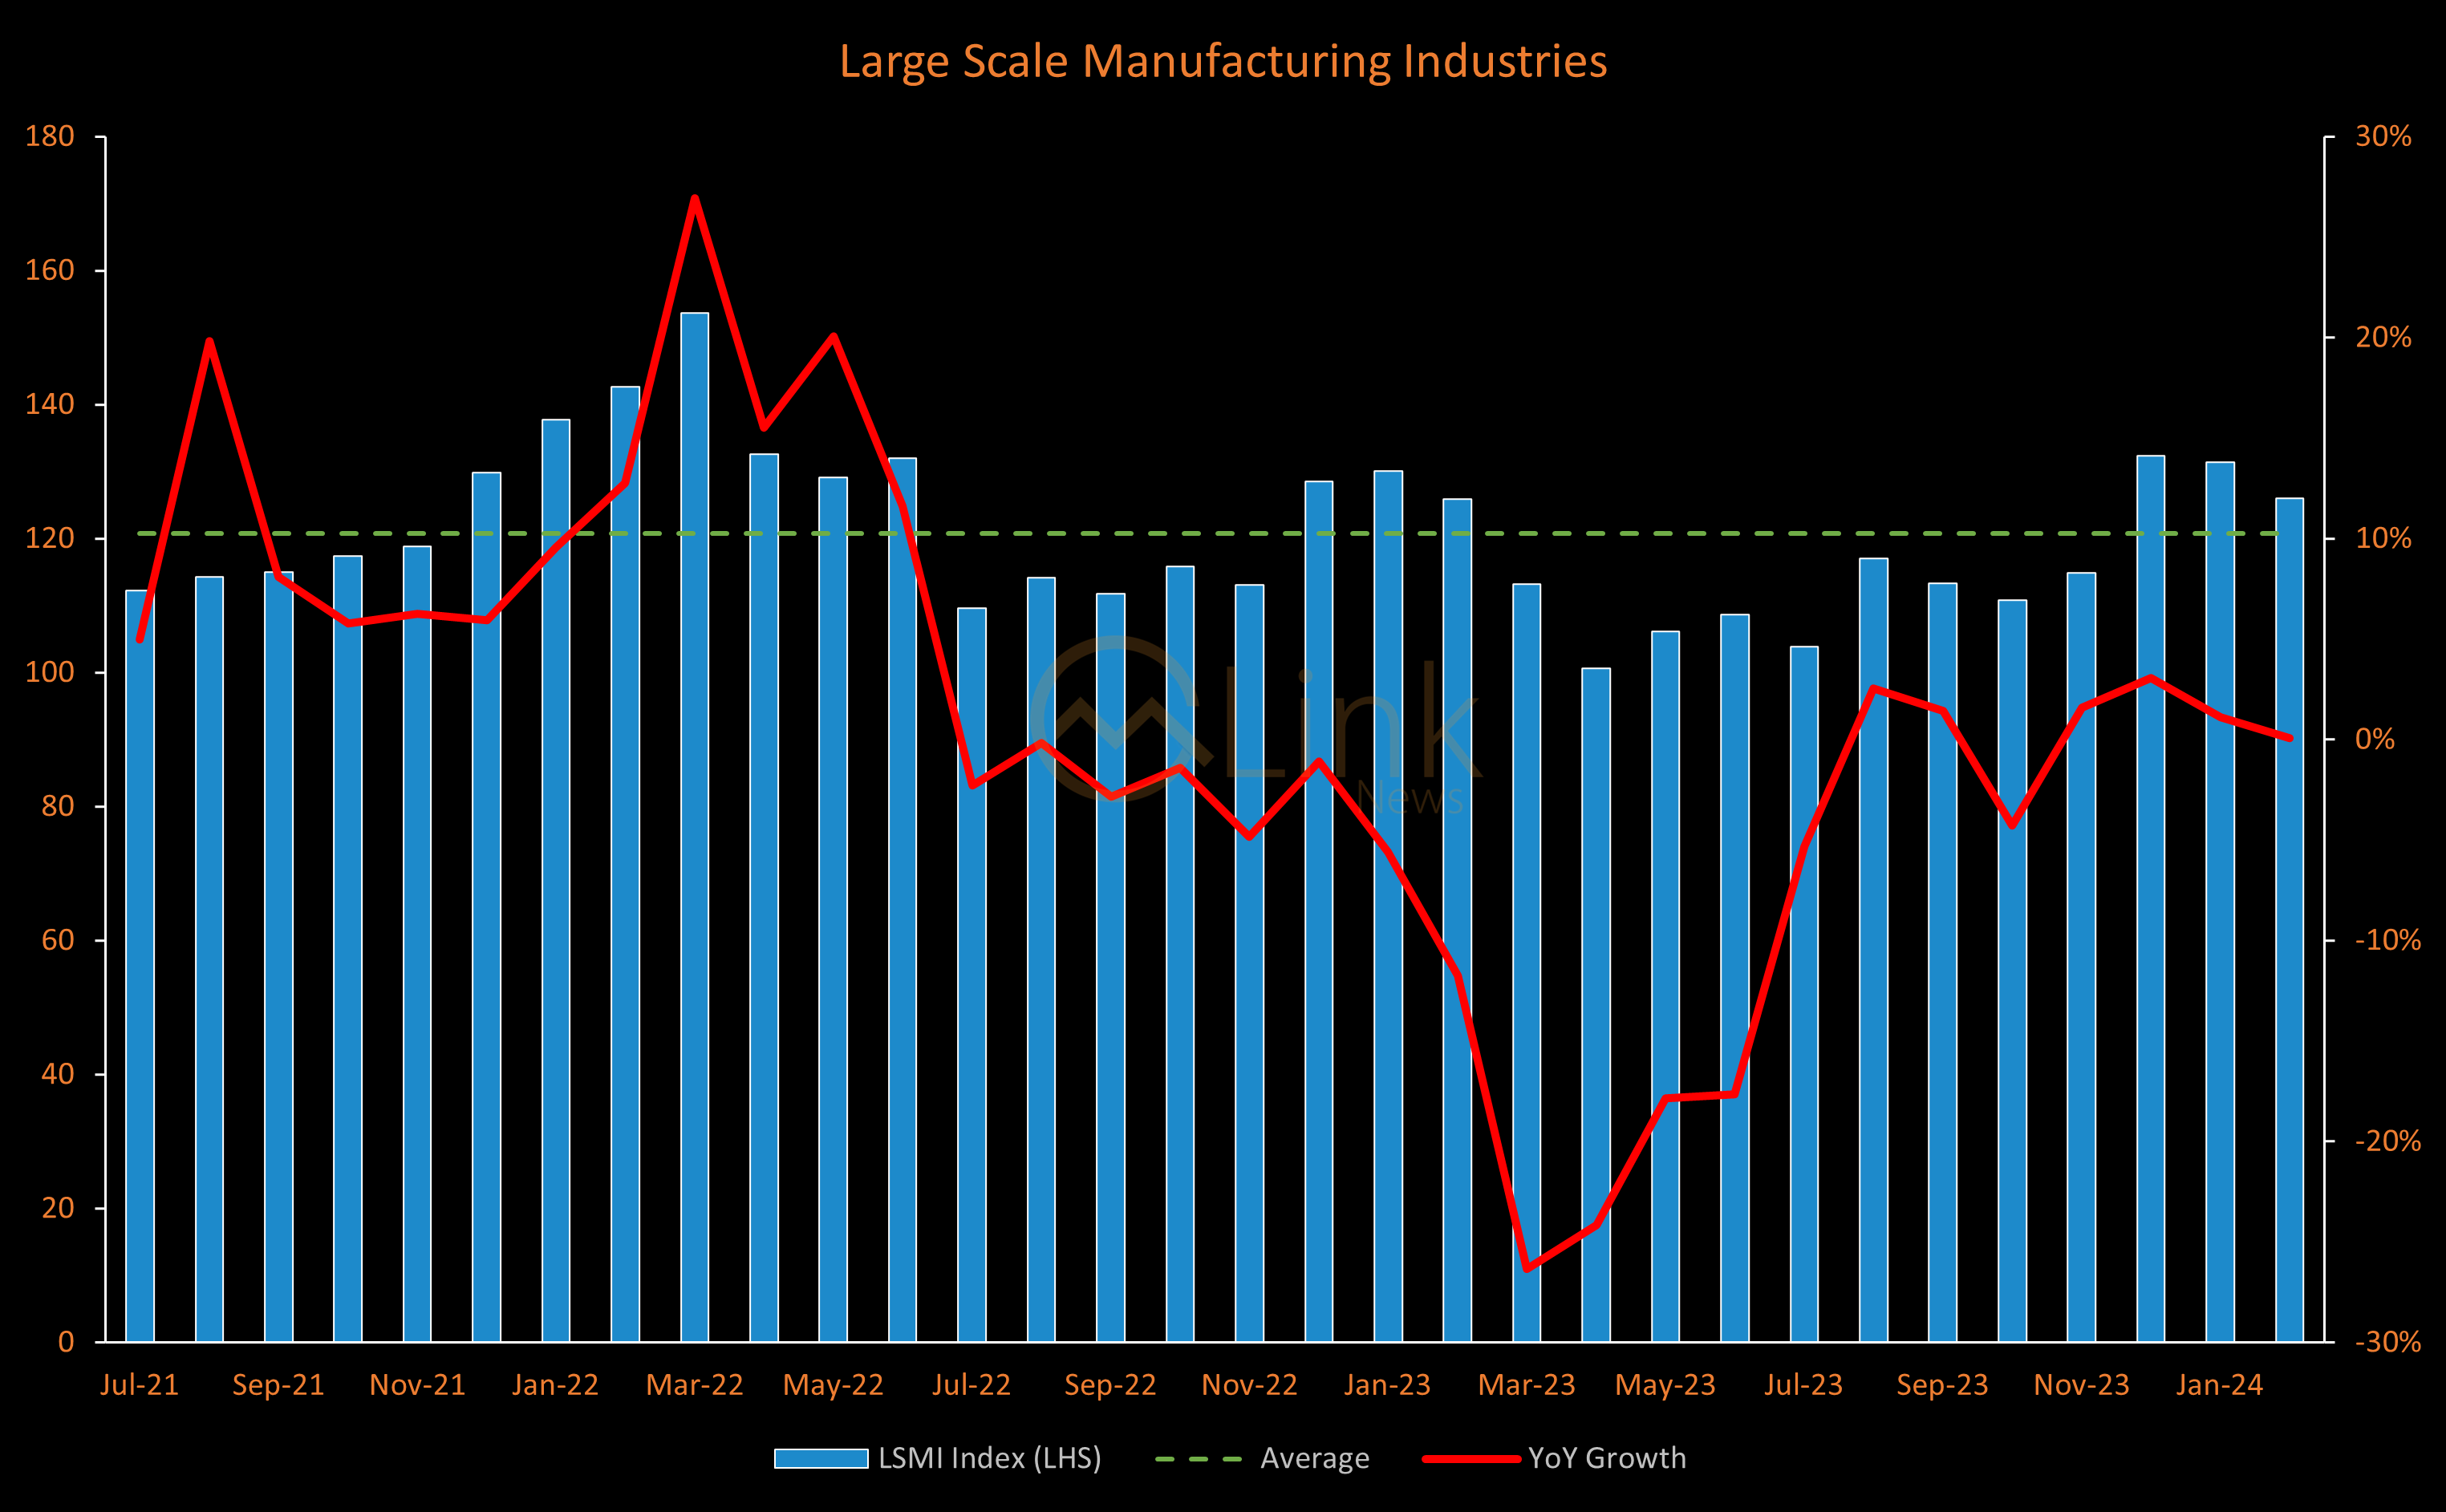
The main contributors towards negative growth of 0.51% in 8MFY24, Food (0.46), Tobacco (-0.80), Textile (-1.75) Garments (0.46), Paper & Board (-0.08), Petroleum Products (0.24), Chemicals (0.55), Pharmaceuticals (1.21), Iron & Steel Products (-0.05), Electrical Equipment (-0.26), Automobiles (-1.14), and Furniture (0.72).
The production in July-February FY24 as compared to July-February FY23 has increased in Food, Wearing apparel, Coke & Petroleum Products, Chemicals, Fertilizers, Pharmaceuticals, Machinery and Equipment and Furniture while it decreased in Tobacco, Textile, Paper & Board, Non Metallic Mineral Products, Iron & Steel Products, Electrical Equipment, Automobiles, and Other Transport Equipment.
The provisional quantum indices of LSMI for February 2024 with the base year 2015-16 have been developed on the basis of latest data supplied by the source agencies.
Copyright Mettis Link News
Related News


| Name | Price/Vol | %Chg/NChg |
|---|---|---|
| KSE100 | 175,547.98 222.46M | -0.28% -495.00 |
| ALLSHR | 106,217.19 709.01M | -0.31% -326.35 |
| KSE30 | 52,475.51 75.37M | -0.30% -158.47 |
| KMI30 | 246,569.22 73.34M | -0.60% -1488.01 |
| KMIALLSHR | 67,941.46 275.82M | -0.49% -336.81 |
| BKTi | 50,422.92 36.13M | 0.32% 161.67 |
| OGTi | 34,273.13 4.72M | -0.95% -328.23 |
| Symbol | Bid/Ask | High/Low |
|---|
| Name | Last | High/Low | Chg/%Chg |
|---|---|---|---|
| BITCOIN FUTURES | 64,715.00 | 65,010.00 63,305.00 | 1175.00 1.85% |
| BRENT CRUDE | 89.41 | 93.31 88.85 | -1.33 -1.47% |
| RICHARDS BAY COAL MONTHLY | 105.75 | 0.00 0.00 | -0.10 -0.09% |
| ROTTERDAM COAL MONTHLY | 119.90 | 0.00 0.00 | 0.00 0.00% |
| USD RBD PALM OLEIN | 1,175.00 | 1,175.00 1,175.00 | 0.00 0.00% |
| CRUDE OIL - WTI | 83.50 | 85.94 82.97 | -0.96 -1.14% |
| SUGAR #11 WORLD | 14.38 | 14.63 14.37 | -0.12 -0.83% |
Chart of the Day
Latest News
Top 5 things to watch in this week
Pakistan Stock Movers
| Name | Last | Chg/%Chg |
|---|
| Name | Last | Chg/%Chg |
|---|