
LSM grows by 12.74% in Aug

MG News | October 16, 2021 at 12:20 AM GMT+05:00

October 15, 2021 (MLN): The overall output of LSMI increased by 7.26% for July-August FY22 compared to the same period last year.
According to data released by the Pakistan Bureau of Statistics (PBS), the LSMI output increased by 12.74% for August 2021 compared to August 2020 and 2.09%
if compared to July 2021.
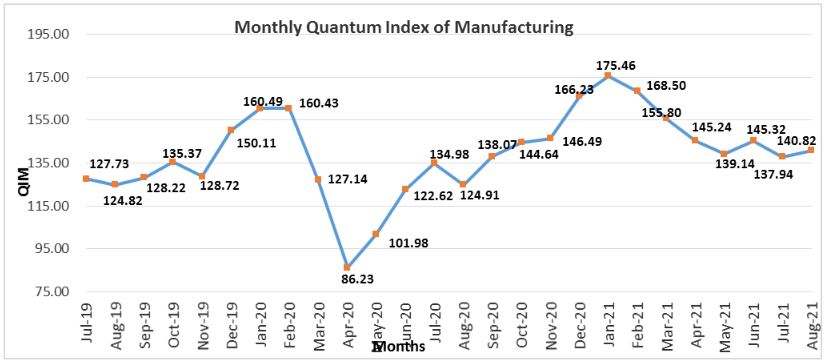
Meanwhile, the major sectors that showed growth during July-Aug FY22 compared to Jul-Aug FY21 included Textile (1.43 percent), Food, Beverages & Tobacco (6.74 percent), Pharmaceuticals (18.67 percent), Chemicals (6.36 percent), Automobiles (55.33 percent), Iron and steel products (14.34 percent), Coke & Petroleum Products (2.35 percent), Non- Metallic Mineral Products (3.72 percent), Leather Products (20.21 percent), Engineering products (6 percent), Paper & Board (10.37 percent) and Wood products (15.81 percent).
On the other hand, the LSM industries that witnessed negative growth, included Fertilizers which declined by 0.87 percent, while Electronics sector plunged by 1.23 percent and Rubber Products dipped by 30.81 percent.
It is pertinent to mention here that the provisional QIM for Aug’21 with the base year 2005-06 has been developed on the basis of the latest production data received from sources including the Oil Companies Advisory Committee (OCAC), Ministry of Industries and Production (MoIP) and Provincial Bureaus of Statistics (PBoS).
Copyright Mettis Link News
Related News



| Name | Price/Vol | %Chg/NChg |
|---|---|---|
| KSE100 | 162,374.88 110.96M | -0.95% -1549.44 |
| ALLSHR | 98,620.11 386.58M | -0.91% -906.77 |
| KSE30 | 47,823.16 51.47M | -1.02% -490.65 |
| KMI30 | 232,733.99 57.93M | -1.23% -2903.19 |
| KMIALLSHR | 63,955.68 197.75M | -1.12% -727.41 |
| BKTi | 44,724.17 14.61M | -1.01% -457.04 |
| OGTi | 33,033.72 5.00M | -1.08% -361.88 |
| Symbol | Bid/Ask | High/Low |
|---|
| Name | Last | High/Low | Chg/%Chg |
|---|---|---|---|
| BITCOIN FUTURES | 80,725.00 | 81,450.00 80,195.00 | -480.00 -0.59% |
| BRENT CRUDE | 117.38 | 117.45 112.74 | 4.21 3.72% |
| RICHARDS BAY COAL MONTHLY | 128.50 | 0.00 0.00 | -1.10 -0.85% |
| ROTTERDAM COAL MONTHLY | 147.10 | 0.00 0.00 | 1.10 0.75% |
| USD RBD PALM OLEIN | 1,182.50 | 1,182.50 1,182.50 | 0.00 0.00% |
| CRUDE OIL - WTI | 103.44 | 103.92 98.84 | 3.97 3.99% |
| SUGAR #11 WORLD | 20.26 | 20.51 20.02 | 0.13 0.65% |
Chart of the Day
Latest News
Top 5 things to watch in this week
 Repatriation of Profit and Dividend
Pakistan Stock Movers
| Name | Last | Chg/%Chg |
|---|
| Name | Last | Chg/%Chg |
|---|