
Weekly Market Roundup
MG News | October 24, 2026 at 10:46 AM GMT+05:00

October 24, 2026 (MLN): The
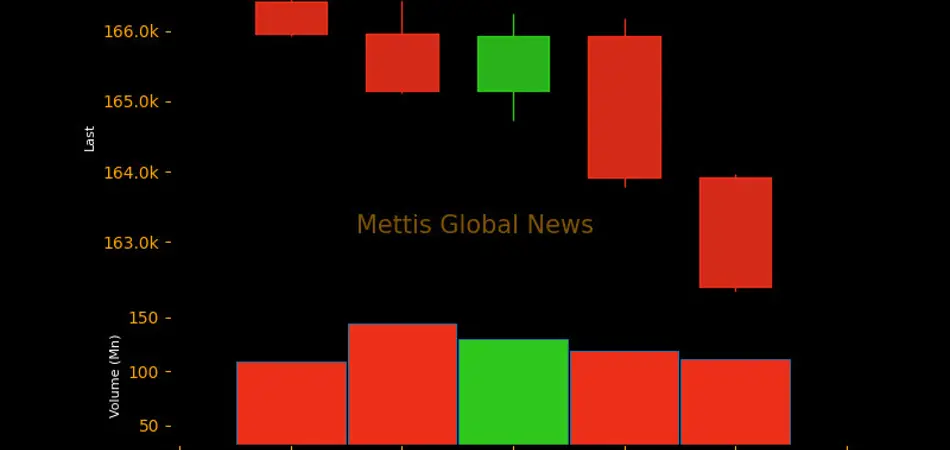
benchmark KSE-100 Index closed the week ended October 23, 2026, at 162,374.88
points, losing 4,044.84 points, or 2.43% week-on-week, from 166,419.72 points
recorded on October 16, 2026.
The market remained under
pressure during the week as intensifying hostilities between Saudi Arabia and
Yemen-based Houthis and a surge in international oil prices heightened
geopolitical uncertainty and dampened investor sentiment.
Rising oil prices also fuelled
concerns over Pakistan’s energy import bill and external account pressures,
triggering selling across the benchmark index.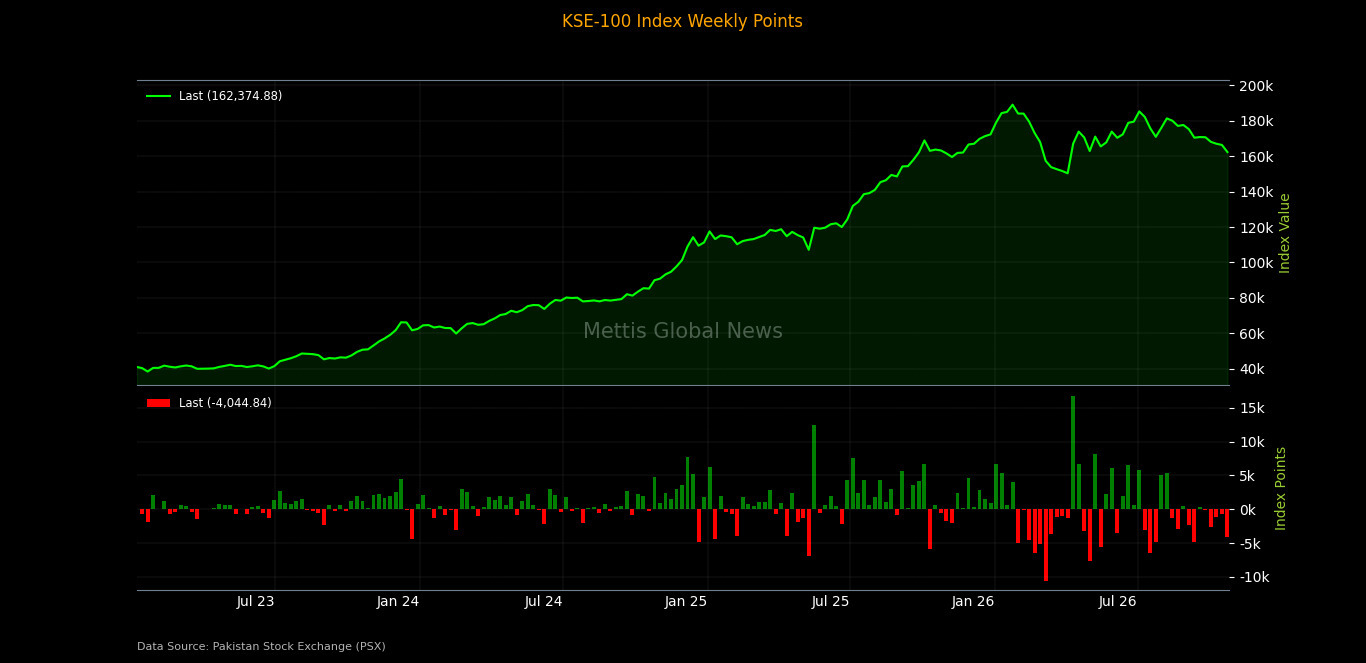
Market Capitalization
The Pakistan Stock Exchange's
market capitalization declined to Rs4.554 trillion during the week, compared
with Rs4.680tr on October 16, 2026, registering a decrease of approximately
Rs126.46 billion, or 2.70% week-on-week.
In dollar terms, market
capitalization fell from $16.901bn to $16.449bn, declining by approximately
$451.46 million, or 2.67% WoW._20261024054145543_1ce008.jpeg)
The market's USD-adjusted return
stood at -2.40%, compared with -0.37% in the previous week, indicating a
sharper decline after accounting for currency movements.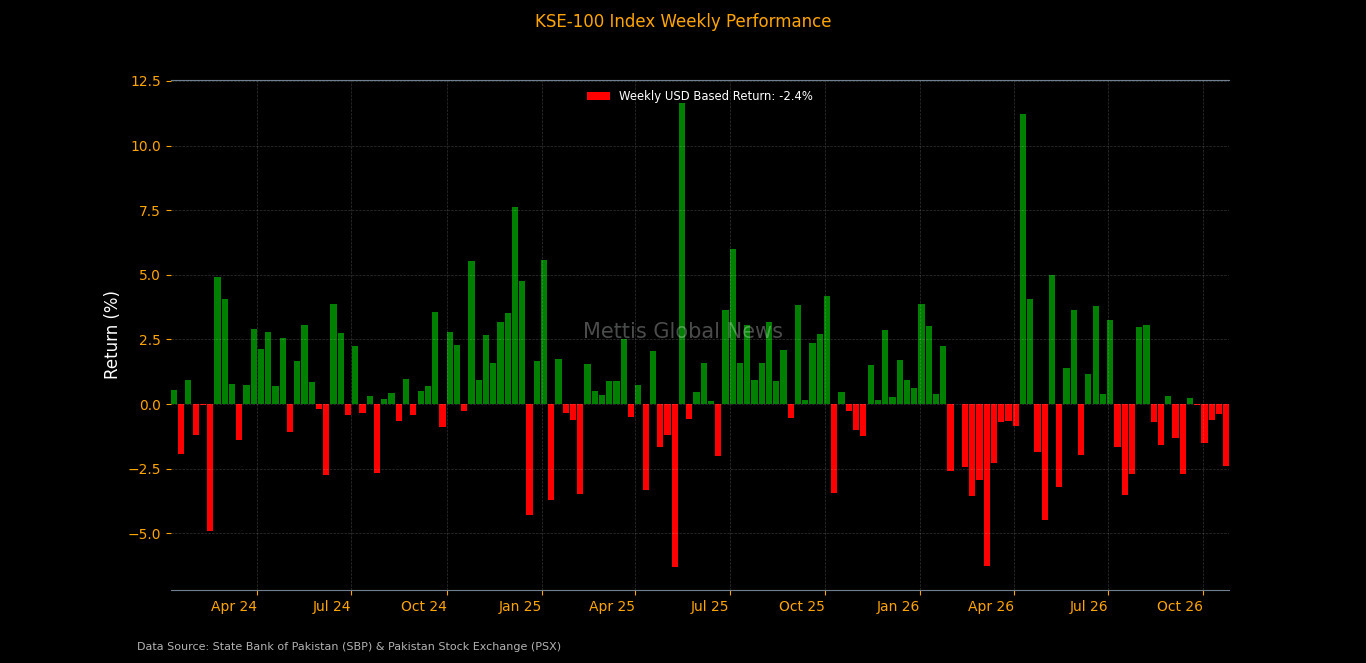
On the macroeconomic front, Foreign
investors repatriated $306.8m in profits and dividends from Pakistan in
September 2026, up 3.58% MoM and 92.96% YoY, taking cumulative outflows in
Jul-Sep FY27 to $864.3m, up 7.67% YoY, with China, the UK, and South Korea
among the largest recipients during the month.
Pakistan
received $3.74bn in external financing in September 2026, taking cumulative
inflows to $5.45bn in the first quarter of FY27, according to the Economic
Affairs Division.
Pakistan’s
banking sector deposit rate rose 12 basis points MoM to 4.29% in September
2026, while the lending rate fell 10bps to 11.89%, narrowing the banking spread
to 760bps, with the real deposit rate slipping to -4.26% amid inflationary
pressures.
Pakistan’s
GDP growth was revised down to 3.65% for FY26 from the earlier estimate of
3.70%, while the economy expanded 2% in Q4 FY26, with its size reaching Rs126.4tr
($450.4bn), according to revised national accounts estimates approved by the
National Accounts Committee.
Pakistan’s
broad money supply (M3) rose 1.39% MoM and 12.61% YoY to Rs50.14tr in
September 2026, marking a second consecutive monthly increase driven by higher
transferable deposits and National Savings balances, according to provisional
State Bank of Pakistan data.
Index Movers
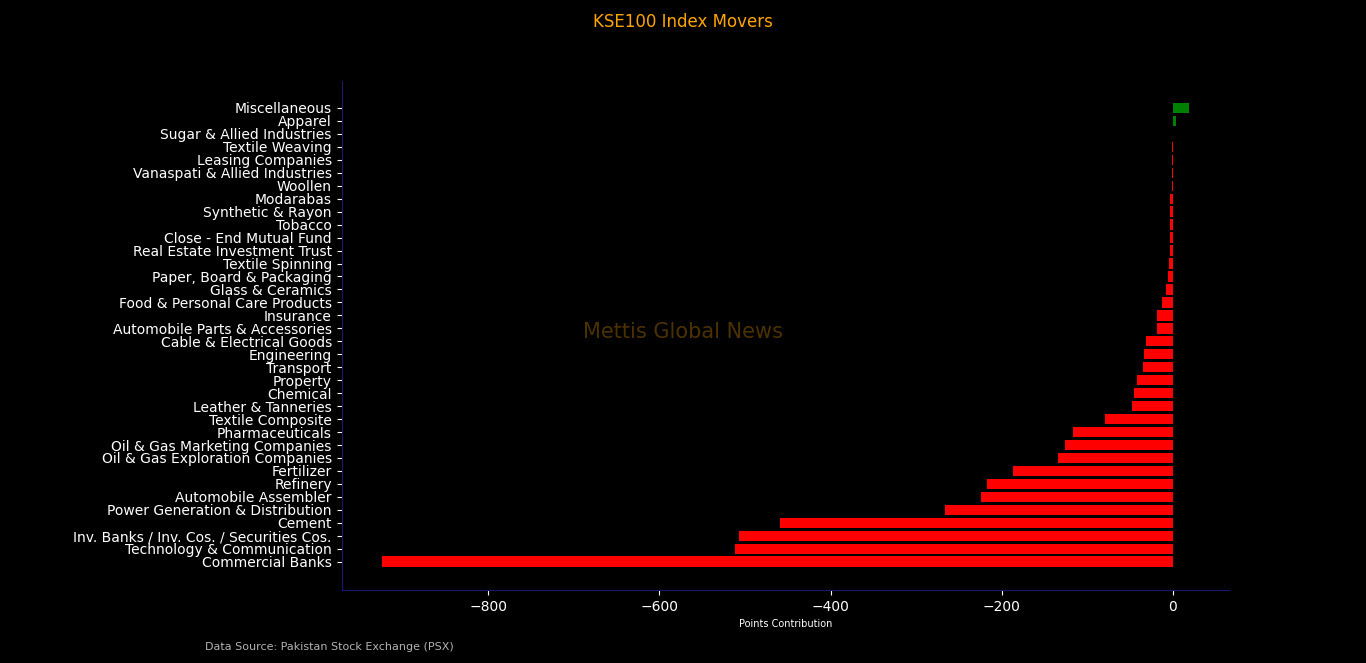
Sector-wise performance was
overwhelmingly negative, with Commercial Banks emerging as the largest drag on
the KSE-100 Index, shedding 924.59 points, followed by Technology &
Communication at 511.51 points, Investment Banks / Investment Companies / Securities
Companies at 506.58 points, Cement at 458.94 points, and Power Generation &
Distribution at 266.08 points.
Other major negative contributors
included Automobile Assembler at 224.50 points, Refinery at 217.06 points,
Fertilizer at 186.48 points, Oil & Gas Exploration Companies at 133.99
points, and Oil & Gas Marketing Companies at 125.56 points.
On the upside, Miscellaneous
provided the largest sectoral support, adding 19.21 points, followed by Apparel
at 4.36 points and Sugar & Allied Industries at 0.47 points.
Among individual stocks, PSEL
emerged as the largest positive contributor to the index, adding 26.33 points,
followed by THCCL at 18.07 points, UPFL at 15.30 points, BWCL at 11.48 points,
and NESTLE at 8.69 points.
On the downside, ENGROH was the
largest drag on the benchmark, erasing 488.87 points, followed by SYS at 277.15
points, LUCK at 225.66 points, ATRL at 195.05 points, and HUBC at 193.27
points._20261024054256616_be9758.jpeg)
FIPI/LIPI
Foreign investors recorded net
equity sales of Rs1.57bn ($5.65m), mainly driven by net selling of Rs2.59bn
($9.35m) by Foreign Corporates. Overseas Pakistanis recorded net purchases of
Rs1.02bn ($3.68m), while Foreign Individuals posted net purchases of Rs4.30m
($15,526).
Local investors recorded net
equity purchases of Rs1.57bn ($5.65m), led by Individuals at Rs3.89bn
($14.04m), Banks/DFIs at Rs549.01m ($1.98m), and Companies at Rs397.24m
($1.43m). Mutual Funds were the largest net sellers at Rs2.83bn ($10.21m),
followed by Broker Proprietary Trading at Rs434.00m ($1.57m) and Insurance
Companies at Rs399.09m ($1.44m).
In the debt market, Mutual Funds
recorded net purchases of Rs10.72bn ($38.69m), while Banks/DFIs posted the
largest net sales at Rs16.65bn ($60.11m)._20261024054245341_f532ec.jpeg)
Copyright Mettis Link News
Related News


| Name | Price/Vol | %Chg/NChg |
|---|---|---|
| KSE100 | 162,374.88 110.96M | -0.95% -1549.44 |
| ALLSHR | 98,620.11 386.58M | -0.91% -906.77 |
| KSE30 | 47,823.16 51.47M | -1.02% -490.65 |
| KMI30 | 232,733.99 57.93M | -1.23% -2903.19 |
| KMIALLSHR | 63,955.68 197.75M | -1.12% -727.41 |
| BKTi | 44,724.17 14.61M | -1.01% -457.04 |
| OGTi | 33,033.72 5.00M | -1.08% -361.88 |
| Symbol | Bid/Ask | High/Low |
|---|
| Name | Last | High/Low | Chg/%Chg |
|---|---|---|---|
| BITCOIN FUTURES | 80,785.00 | 81,450.00 80,440.00 | -420.00 -0.52% |
| BRENT CRUDE | 117.38 | 117.45 112.74 | 4.21 3.72% |
| RICHARDS BAY COAL MONTHLY | 128.50 | 0.00 0.00 | -1.10 -0.85% |
| ROTTERDAM COAL MONTHLY | 147.10 | 0.00 0.00 | 1.10 0.75% |
| USD RBD PALM OLEIN | 1,182.50 | 1,182.50 1,182.50 | 0.00 0.00% |
| CRUDE OIL - WTI | 103.44 | 103.92 98.84 | 3.97 3.99% |
| SUGAR #11 WORLD | 20.26 | 20.51 20.02 | 0.13 0.65% |
Chart of the Day
Latest News
Top 5 things to watch in this week
 Repatriation of Profit and Dividend
Pakistan Stock Movers
| Name | Last | Chg/%Chg |
|---|
| Name | Last | Chg/%Chg |
|---|