
Weekly Market Roundup
MG News | September 26, 2026 at 08:09 PM GMT+05:00

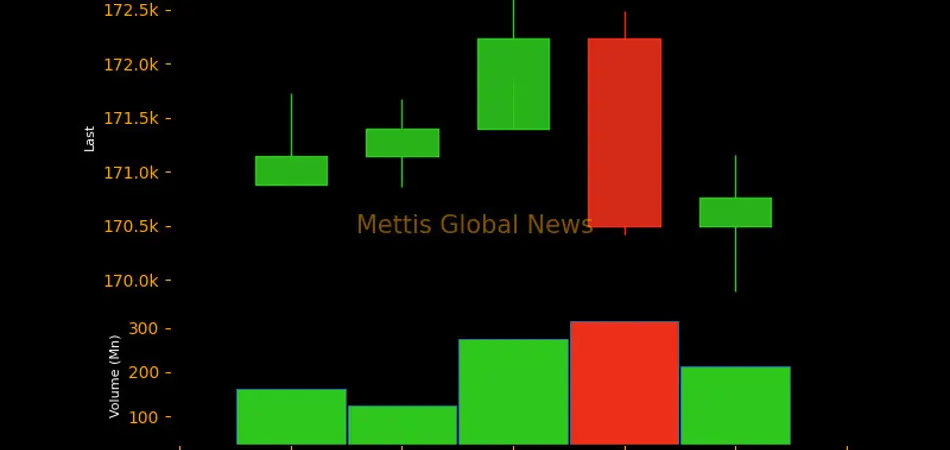
September 26, 2026 (MLN): The benchmark KSE-100 Index
closed the week at 170,765.22 points, down 119.37 points or 0.07% on
a week-on-week basis from 170,884.59 points recorded on September
18, 2026.
The weekly market performance remained influenced by
improving domestic economic indicators and expectations surrounding progress on
the ongoing IMF review, which provided some support to investor sentiment.
However, gains remained limited as market participants
continued to closely monitor developments in the US-Iran dialogue and movements
in global oil prices amid persistent geopolitical risks in the Middle East._20260926150129560_57f0a8.jpeg)
Market Capitalization
The Pakistan Stock Exchange's market capitalization declined
to Rs4.805 trillion during the week, compared with Rs4.815 trillion
on September 18, 2026, registering a decrease of approximately Rs9.79bn, or
0.20% WoW.
In dollar terms, market capitalization fell from $17.366bn
to $17.336bn, decreasing by approximately $29.67 million, or 0.17%
WoW._20260926150105954_67a22a.jpeg)
The market's USD-adjusted return stood at -0.04%,
compared with 0.24% in the previous week, showing a marginal decline
after accounting for currency movements.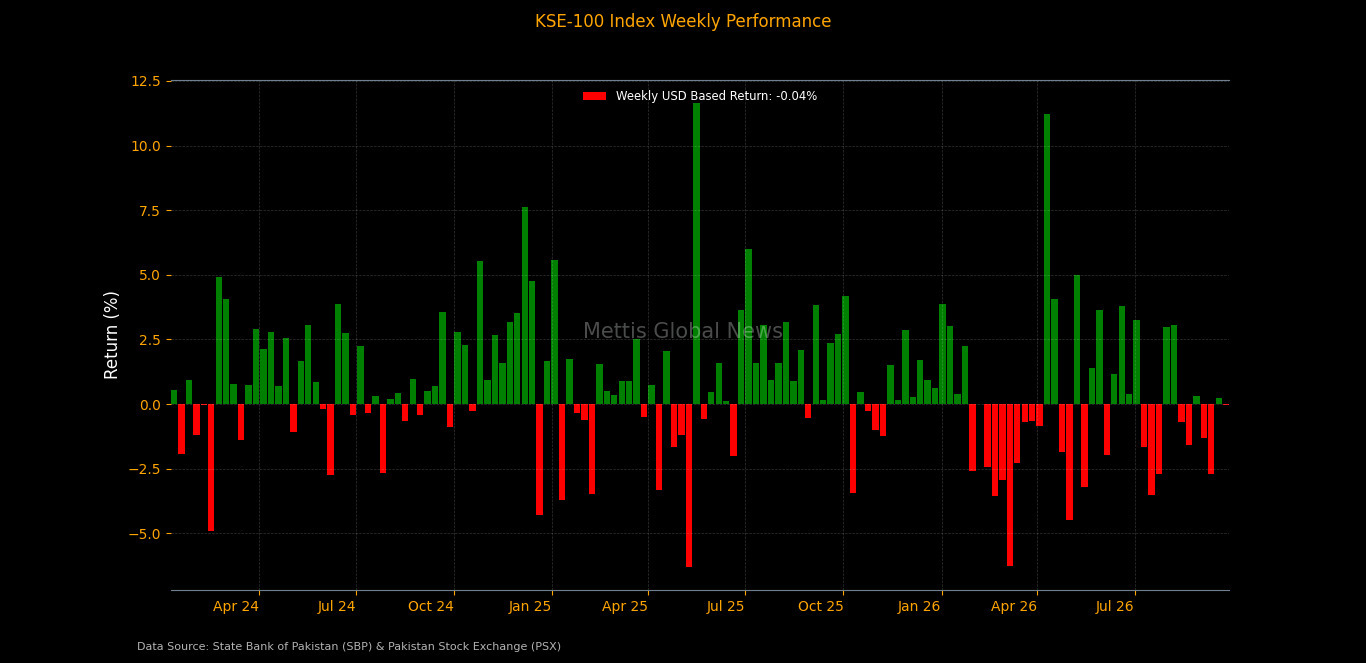
On the macroeconomic front, Pakistan’s
weekly inflation, measured by the Sensitive Price Indicator (SPI), rose
0.99% in the week ended September 24, 2026, while the index recorded a 11.92%
YoY increase.
Pakistan’s
total foreign exchange reserves rose $19.4m WoW to $26.81bn in the week
ended September 18, 2026, while SBP-held reserves increased $11.3m to $21.4bn.
Pakistan’s broad money supply (M3) rose 0.21% MoM to Rs49.45 trillion in August 2026, while recording an 11.43% YoY increase.
Index Movers
Sector-wise performance was mixed during the week. Fertilizer
provided the largest support to the KSE-100 Index at 171.09 points,
followed by Oil & Gas Exploration Companies at 119.96 points, Oil
& Gas Marketing Companies at 99.78 points, Refinery at 88.77
points, Inv. Banks / Inv. Cos. / Securities Cos. at 86.60 points,
Cement at 72.25 points, Pharmaceuticals at
37.24 points, Property at 29.17 points, Engineering at 26.09
points, Leather & Tanneries at 25.38 points, and Tobacco at
19.53 points.
Other sectors contributing positively included Paper,
Board & Packaging at 4.76 points, Close-End Mutual Fund at 1.89
points, Insurance at 1.04 points, Vanaspati & Allied Industries
at 0.36 points, and Leasing Companies at 0.12 points.
On the downside, Commercial Banks emerged as the
largest drag on the index at 365.89 points, followed by Miscellaneous
at 141.37 points, Power Generation & Distribution at 140.00 points,
Technology & Communication at 102.91 points, Automobile
Parts & Accessories at 23.76 points, Glass & Ceramics at
23.62 points, Automobile Assembler at 23.13 points, Synthetic &
Rayon at 18.48 points, Real Estate Investment Trust at 16.35 points,
and Cable & Electrical Goods at 15.35 points.
Other sectors weighing on the index included Food &
Personal Care Products at 14.43 points, Transport at 10.28 points, Sugar
& Allied Industries at 3.94 points, Textile Composite at 1.44
points,
Chemical at 1.12 points, Modarabas at 0.57
points, Woollen at 0.52 points, Textile Weaving at 0.12 points,
and Textile Spinning at 0.12 points.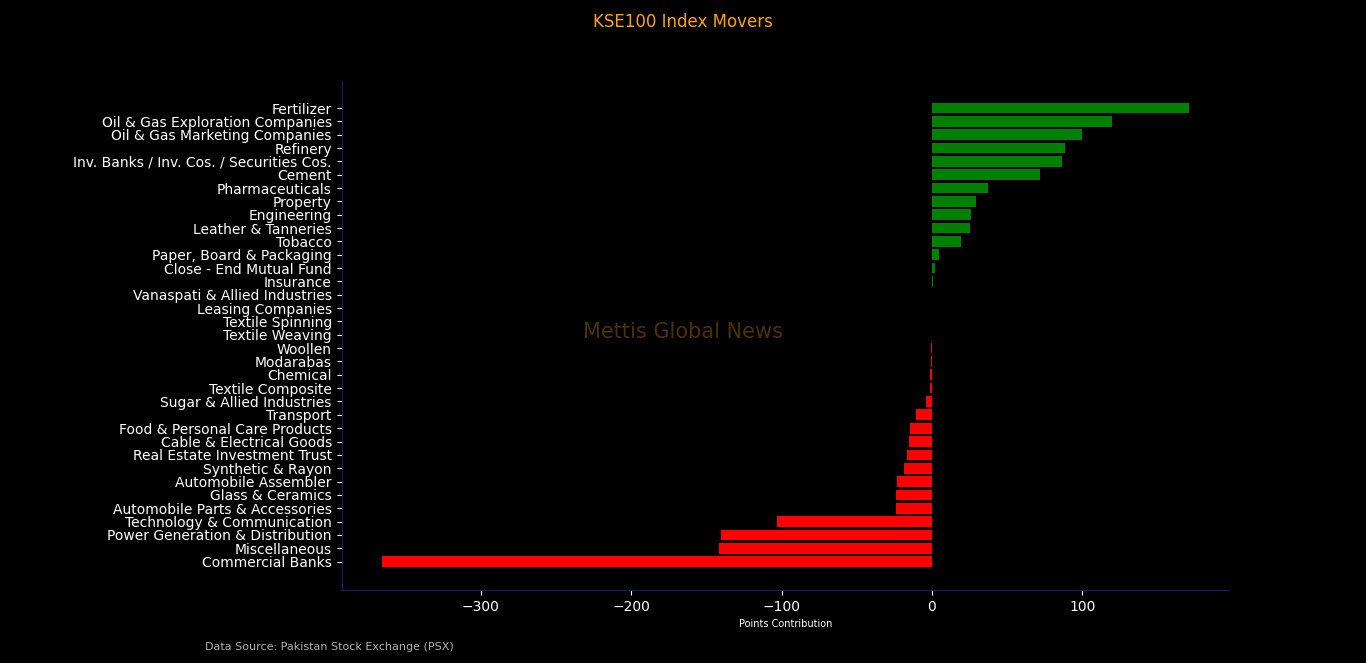
Among individual stocks, EFERT emerged as the largest
positive contributor to the index, adding 150.55 points, followed by HBL
at 93.83 points, ATRL at 76.08 points, PSO at 72.83 points, PPL
at 68.53 points, MARI at 66.65 points, ENGROH at 61.31 points, FCCL
at 35.09 points, FFC at 34.60 points, and JVDC at 29.17 points.
Other major positive contributors included SEARL at
28.64 points, POL at 26.52 points, CHCC at 26.18 points, SRVI
at 25.38 points, PSX at 25.29 points, TRG at 22.43 points, PAKT
at 19.53 points, HINOON at 17.54 points, AGP at 16.12 points, and
SNGP at 16.05 points.
On the downside, PSEL was the biggest drag on the
benchmark, erasing 157.86 points, followed by MCB at 118.81
points, NBP at 90.65 points, SYS at 86.11 points, KEL at
74.59 points, MEBL at 74.07 points, HUBC at 63.27 points, UBL
at 63.23 points, BAHL at 60.14 points, and BOP at 41.26 points.
Other major negative contributors included OGDC at
41.73 points, PTC at 30.15 points, FATIMA at 25.08 points, THALL
at 23.76 points, TGL at 21.88 points, IBFL at 18.48 points, MTL
at 15.95 points, PAEL at 15.35 points, GLAXO at 14.99 points, and
AIRLINK at 14.29 points._20260926150043047_907ff8.jpeg)
FIPI/LIPI
Foreign investors remained net sellers during the week,
recording net equity sales of Rs571.76m ($2.06m). Foreign Corporates
recorded net equity sales of Rs617.60m ($2.23m), while Overseas
Pakistanis recorded net equity purchases of Rs45.84m ($165,488).
On the local side, investors remained net buyers in the
equity market, recording net purchases of Rs571.76m ($2.06m).
Other Organizations emerged as the largest local
equity buyers, with net purchases of Rs1.15bn ($4.13m), followed by Companies
with Rs1.10bn ($3.97m),
Banks/DFIs with Rs354.40m ($1.28m), Individuals
with Rs261.16m ($942,824), NBFCs with Rs175.27m ($632,734), and Insurance
Companies with Rs20.92m ($75,519).
Meanwhile, Mutual Funds remained the largest local
equity sellers, with net sales of Rs1.76bn ($6.35m), followed by Broker
Proprietary Trading with Rs727.69m ($2.63m).
In the debt market, Mutual Funds remained the largest
net buyers with Rs28.51bn ($102.92m), followed by Insurance Companies
with Rs3.46bn ($12.47m),
Other Organizations with Rs419.77m ($1.52m), Individuals
with Rs193.96m ($700,202), and Broker Proprietary Trading with Rs2.86m
($10,340).
On the other hand, Banks/DFIs recorded net debt sales
of Rs32.28bn ($116.53m), while Companies recorded net debt sales of
Rs302.45m ($1.09m).
Overall, local investors recorded a net purchase of
Rs571.76m ($2.06m) across the equity and debt markets._20260926150050351_41a709.jpeg)
Copyright Mettis Link News
Related News
_20261024054136356_ebb6c5.jpeg?width=280&height=140&format=Webp)
.png?width=280&height=140&format=Webp)

| Name | Price/Vol | %Chg/NChg |
|---|---|---|
| KSE100 | 162,374.88 110.96M | -0.95% -1549.44 |
| ALLSHR | 98,620.11 386.58M | -0.91% -906.77 |
| KSE30 | 47,823.16 51.47M | -1.02% -490.65 |
| KMI30 | 232,733.99 57.93M | -1.23% -2903.19 |
| KMIALLSHR | 63,955.68 197.75M | -1.12% -727.41 |
| BKTi | 44,724.17 14.61M | -1.01% -457.04 |
| OGTi | 33,033.72 5.00M | -1.08% -361.88 |
| Symbol | Bid/Ask | High/Low |
|---|
| Name | Last | High/Low | Chg/%Chg |
|---|---|---|---|
| BITCOIN FUTURES | 80,785.00 | 81,450.00 80,440.00 | -420.00 -0.52% |
| BRENT CRUDE | 117.38 | 117.45 112.74 | 4.21 3.72% |
| RICHARDS BAY COAL MONTHLY | 128.50 | 0.00 0.00 | -1.10 -0.85% |
| ROTTERDAM COAL MONTHLY | 147.10 | 0.00 0.00 | 1.10 0.75% |
| USD RBD PALM OLEIN | 1,182.50 | 1,182.50 1,182.50 | 0.00 0.00% |
| CRUDE OIL - WTI | 103.44 | 103.92 98.84 | 3.97 3.99% |
| SUGAR #11 WORLD | 20.26 | 20.51 20.02 | 0.13 0.65% |
Chart of the Day
Latest News
Top 5 things to watch in this week
 Repatriation of Profit and Dividend
Pakistan Stock Movers
| Name | Last | Chg/%Chg |
|---|
| Name | Last | Chg/%Chg |
|---|