
Pakistan slashes FY26 fiscal deficit 46% to Rs3.3tr
MG News | August 13, 2026 at 03:19 PM GMT+05:00

August 13, 2026 (MLN): Pakistan closed FY26 with a significant fiscal turnaround, moving away from years of recurring fiscal stress toward stronger public finances, stability, and sustainable growth.
The fiscal deficit narrowed to Rs3.313tr, equivalent to 2.6%
of GDP, the lowest level in 22 years, down 46%YoY from Rs6.168tr (5.4% of GDP)
in FY25. The improvement extends a broader consolidation trend, with the fiscal
deficit narrowing by 5.2 percentage points of GDP over the past three years.
The primary balance posted a surplus of Rs3.634tr, or 2.9%
of GDP, the highest primary surplus in at least 26 years, up 34%YoY from
Rs2.719tr (2.4% of GDP) in FY25.
FY26 marks the third consecutive year of primary surpluses,
reflecting sustained fiscal discipline on the expenditure side even as
debt-servicing costs remained elevated for much of the period.
On the revenue side, total collections rose 10%YoY to
Rs19.774tr (15.6% of GDP), driven primarily by a 12%YoY increase in tax revenue
to Rs14.219tr.
Within tax revenue, direct taxes grew 14%YoY to Rs6.586tr,
sales tax collections rose 9%YoY to Rs4.254tr, customs duties increased 4%YoY
to Rs1.331tr, and federal excise duty rose 10%YoY to Rs840bn. Provincial tax
collections grew 24%YoY to Rs1.209tr.
Non-tax revenue rose 5%YoY to Rs5.555tr, with growth led by
petroleum levy collections, up 28%YoY to Rs1.567tr, alongside gains in
royalties on oil and gas and dividend receipts. This was partly offset by a
7%YoY decline in surplus profit transfers from the State Bank of Pakistan.
Total expenditure declined 4%YoY to Rs23.087tr (18.2% of
GDP), from Rs24.166tr (21.1% of GDP) in FY25. Current expenditure fell 4%YoY to
Rs20.686tr, primarily on account of a 22%YoY drop in mark-up payments to
Rs6.948tr as monetary easing reduced the cost of domestic debt servicing.
Defence expenditure rose 18%YoY to Rs2.588tr.
Development expenditure and net lending increased 10%YoY to
Rs3.254tr, keeping the development-to-GDP ratio steady at 2.6%.
On financing, the domestic sector remained the primary
source of deficit financing, though its share declined as external inflows
picked up. Net external financing rose 90%YoY to Rs1.178tr, while net domestic
financing fell 61%YoY to Rs2.136tr from Rs5.549tr in FY25.
Alongside the narrower deficit, debt growth slowed to a
20-year low over the year, with both the debt-to-GDP ratio and the interest
burden on the budget declining.
The improvement in fiscal metrics was recognized by S&P
Global Ratings, which upgraded Pakistan's sovereign rating to 'B' with a
'Stable' outlook, citing stronger fiscal consolidation and improving sovereign
fundamentals.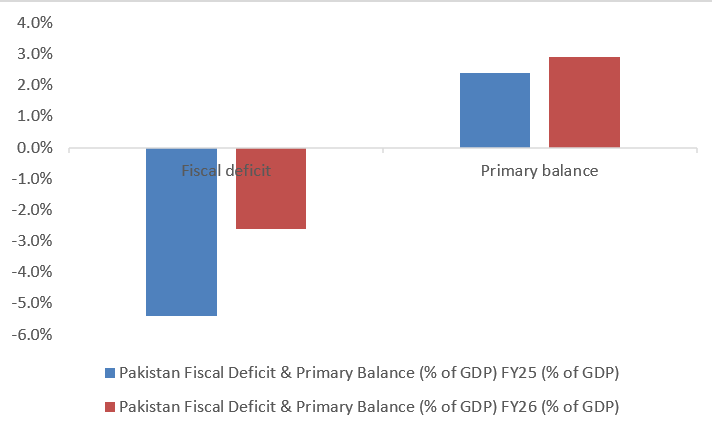
Summary of consolidated fiscal operations (FY26 vs FY25)
|
Item (Rs bn) |
FY26 |
FY25 |
YoY |
% of GDP FY26 |
% of GDP FY25 |
|
Total Revenue |
19,774 |
17,997 |
+10% |
15.6% |
15.7% |
|
Tax Revenue |
14,219 |
12,723 |
+12% |
11.2% |
11.1% |
|
Non-Tax Revenue |
5,555 |
5,275 |
+5% |
4.4% |
4.6% |
|
Total Expenditure |
23,087 |
24,166 |
-4% |
18.2% |
21.1% |
|
Current Expenditure |
20,686 |
21,529 |
-4% |
16.3% |
18.8% |
|
Mark-up Payments |
6,948 |
8,887 |
-22% |
5.5% |
7.7% |
|
Development Expenditure & net lending |
3,254 |
2,966 |
+10% |
2.6% |
2.6% |
|
Overall Budget Balance |
-3,313 |
-6,168 |
-46% |
-2.6% |
-5.4% |
|
Primary Balance |
3,634 |
2,719 |
+34% |
2.9% |
2.4% |
|
External Financing (net) |
1,178 |
619 |
+90% |
— |
— |
|
Domestic Financing (net) |
2,136 |
5,549 |
-61% |
— |
— |
Copyright Mettis Link News
Related News

_20260101112329999_0153db.webp?width=280&height=140&format=Webp)

| Name | Price/Vol | %Chg/NChg |
|---|---|---|
| KSE100 | 162,589.30 39.75M | -0.81% -1335.01 |
| ALLSHR | 98,871.77 147.97M | -0.66% -655.11 |
| KSE30 | 47,886.40 18.59M | -0.88% -427.40 |
| KMI30 | 233,598.53 23.35M | -0.87% -2038.65 |
| KMIALLSHR | 64,181.50 88.83M | -0.78% -501.58 |
| BKTi | 44,666.06 6.30M | -1.14% -515.15 |
| OGTi | 33,085.83 1.69M | -0.93% -309.78 |
| Symbol | Bid/Ask | High/Low |
|---|
| Name | Last | High/Low | Chg/%Chg |
|---|---|---|---|
| BITCOIN FUTURES | 81,740.00 | 81,920.00 81,055.00 | 285.00 0.35% |
| BRENT CRUDE | 114.58 | 114.72 112.74 | 1.41 1.25% |
| RICHARDS BAY COAL MONTHLY | 128.50 | 0.00 0.00 | -1.55 -1.19% |
| ROTTERDAM COAL MONTHLY | 147.10 | 0.00 0.00 | 1.80 1.24% |
| USD RBD PALM OLEIN | 1,167.50 | 1,167.50 1,167.50 | 0.00 0.00% |
| CRUDE OIL - WTI | 100.92 | 100.98 98.84 | 1.45 1.46% |
| SUGAR #11 WORLD | 20.13 | 20.64 20.10 | -0.32 -1.56% |
Chart of the Day
Latest News
Top 5 things to watch in this week
 Repatriation of Profit and Dividend
Pakistan Stock Movers
| Name | Last | Chg/%Chg |
|---|
| Name | Last | Chg/%Chg |
|---|