Loan demand slips in Q3-FY26

MG News | May 15, 2026 at 09:17 AM GMT+05:00

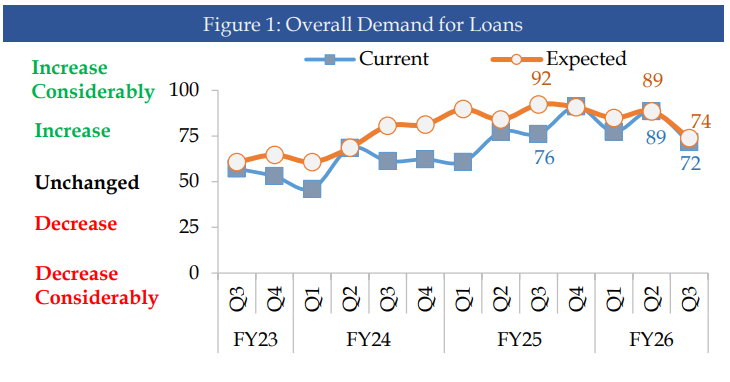
May 15, 2026 (MLN): Current loan demand declined to
72 in Q3-FY26 from 89 in the previous quarter, slipping out of the
"Increase Considerably" zone, according to the latest Bank Lending
Survey (BLS) for Q3-FY26, conducted by the State Bank of Pakistan (SBP) during
April 1–30, 2026, covering 44 respondent banks.
Meanwhile, future loan demand expectations also moderated
sharply, falling to 74 from 89 in Q2-FY26, primarily driven by concerns over
general economic activity and deteriorating security conditions.
This marks a reversal from the upward trajectory observed in previous quarters, as key demand drivers including monetary policy decisions (down to 57 from 82), fixed investment needs (56 from 66), and inventories and working capital requirements (63 from 77) all recorded notable declines compared to Q2-FY26.
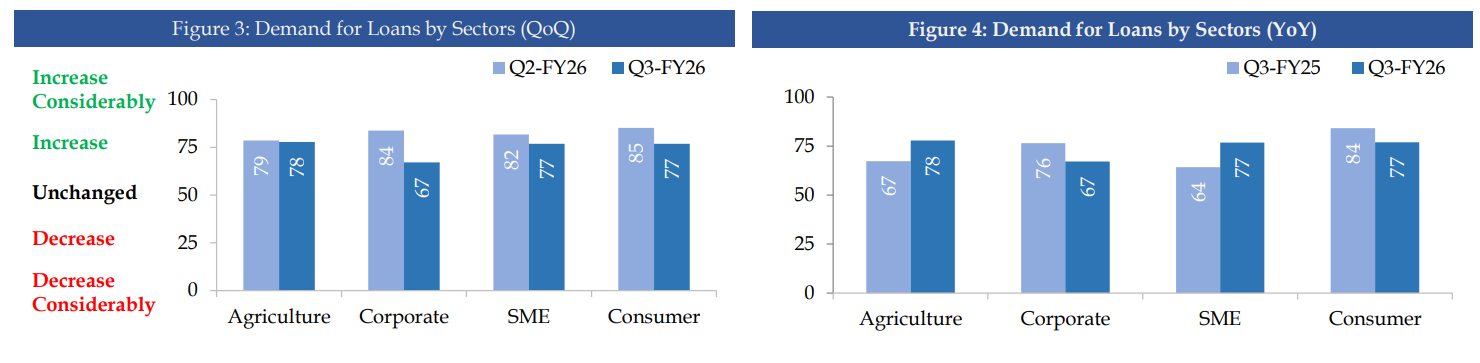
Sector-Wise Growth
A sectoral YoY breakdown reveals a mixed picture.
Agriculture loan demand improved to 78 from 67 in Q3-FY25, and SME demand rose
to 77 from 64, reflecting resilience in these segments. However, corporate loan
demand dipped to 67 from 76 (YoY), while consumer loan demand eased to 77 from
84 in the same period.
On a QoQ basis, all sectors recorded a slowdown. Corporate demand fell from 84 to 67, SME from 82 to 77, Consumer from 85 to 77, and Agriculture marginally from 79 to 78, suggesting broad-based near-term softness across the lending landscape.
Loan Applications
The number of loan applications decelerated during the
quarter, with the current index falling to 73 from 86 in Q2-FY26, though it
remained within the "Increase" zone. Expected loan applications also
eased to 75 from 90 in the prior quarter, signalling a cooling in near-term
credit appetite.
Borrowing Costs
The overall cost of borrowing has inched upward, with the
current borrowing cost index at 47 in Q3-FY26. More notably, expected borrowing
costs have risen sharply to 72 up from 27,
signalling a potential tightening of credit conditions in the quarters ahead.
The rise in expected costs is attributed to shifts in the monetary policy
stance, evolving competition dynamics among banks, and fluctuations in deposit
volumes.
Fund Availability
Overall availability of funds remained within the
"Increase" zone, though momentum slowed during Q3-FY26. The current
fund availability index eased to 68 from 74 in Q2-FY26, while expected
availability also declined to 73 from 80, primarily on account of a weakening
macroeconomic environment.
Key Drivers
The survey highlights several key factors shaping fund
availability. The macroeconomic situation saw the sharpest deterioration, with
its diffusion index plunging to 38 in Q3-FY26 from 59 in Q2-FY26 and 51 in
Q3-FY25, emerging as the primary drag on overall credit conditions. Monetary
policy decisions also weakened considerably, dropping to 57 from 74 in Q2-FY26,
indicating reduced central bank-driven stimulus for credit expansion relative
to prior quarters.
Government borrowing edged up slightly to 55 from 50 in
Q2-FY26, pointing to a marginal increase in fiscal-driven credit pressures.
Bank liquidity remained relatively resilient at 67, down modestly from 72,
ensuring a continued though slightly moderated flow of credit in the market.
Non-performing loans (NPLs) held nearly steady at 49, compared to 48 in Q2-FY26, while the volume of deposits eased to 70 from 80, reflecting some moderation in deposit-driven liquidity. Competition among banks remained at 55 up from 50, maintaining pressure on lending margins.
Copyright Mettis
Link News
Related News


| Name | Price/Vol | %Chg/NChg |
|---|---|---|
| KSE100 | 171,021.20 228.53M | -0.42% -718.25 |
| ALLSHR | 103,836.39 572.65M | -0.41% -422.85 |
| KSE30 | 50,951.99 89.47M | -0.52% -264.77 |
| KMI30 | 240,633.87 93.99M | -0.31% -756.80 |
| KMIALLSHR | 66,572.75 300.61M | -0.28% -185.59 |
| BKTi | 48,673.23 31.18M | -0.70% -343.86 |
| OGTi | 33,702.25 6.35M | -0.61% -205.57 |
| Symbol | Bid/Ask | High/Low |
|---|
| Name | Last | High/Low | Chg/%Chg |
|---|---|---|---|
| BITCOIN FUTURES | 64,115.00 | 64,215.00 64,115.00 | -100.00 -0.16% |
| BRENT CRUDE | 98.70 | 101.19 95.13 | -1.99 -1.98% |
| RICHARDS BAY COAL MONTHLY | 105.75 | 0.00 0.00 | -1.55 -1.44% |
| ROTTERDAM COAL MONTHLY | 121.10 | 121.10 121.10 | 0.70 0.58% |
| USD RBD PALM OLEIN | 1,175.00 | 1,175.00 1,175.00 | 0.00 0.00% |
| CRUDE OIL - WTI | 90.47 | 92.83 87.68 | -1.72 -1.87% |
| SUGAR #11 WORLD | 14.76 | 14.79 14.54 | 0.07 0.48% |
Chart of the Day
Latest News
Top 5 things to watch in this week
Pakistan Stock Movers
| Name | Last | Chg/%Chg |
|---|
| Name | Last | Chg/%Chg |
|---|