
Global food Inflation set to hit 5% by 2027: JPMorgan

MG News | August 28, 2026 at 09:58 AM GMT+05:00

August 28, 2026 (MLN): Global food inflation is projected to accelerate sharply into 2027, climbing from around 2.8% in the first half of 2026 to roughly 5% on an annualized basis by the first half of 2027, according to a new JPMorgan report titled "Food Security is National Security: A Compounding Storm," led by senior global economist Nora Szentivanyi.
The report warns that this acceleration, combined with
energy-related shocks, could add approximately 0.6 percentage points to global
headline inflation and slow the anticipated cooling of prices worldwide.
JPMorgan frames the risk around a set of compounding
pressures it calls the "Five Ws" War, Weather, Warehousing, Water,
and Waste with particular emphasis on fertilizer supply disruptions and the
potential for a "super" El Niño event.
Unlike oil, which benefits from flexible substitutes and
strategic reserves, nitrogen fertilizer has limited near-term alternatives and
must be applied at precise points in the crop cycle, meaning delays reduce
yields regardless of later conditions.
Iran conflict disrupts LNG and fertilizer trade
The Iran conflict, which escalated with strikes beginning
around late February 2026, severely disrupted the Strait of Hormuz, a
chokepoint handling a significant share of global energy and fertilizer trade.
Roughly one-third of the world's nitrogen fertilizer, essential for about half
of global crops, along with a substantial share of seaborne fertilizer trade,
normally transits the strait, with the Middle East supplying a large portion of
global urea and ammonia exports.
UN International Trade Center analysis of Gulf exporters
Bahrain, Iran, Iraq, Kuwait, Qatar, Saudi Arabia, and the UAE showed sharp
declines between periods: LNG exports fell 95% (an absolute decline of about
5.5mn tonnes), urea exports dropped 83%, and ammonia exports fell 75%.
Overall merchandise export volumes across key products
declined around 54%. Qatar's LNG facilities and other regional plants faced
damage or reduced output, affecting feedstock for nitrogen fertilizer
production.
Nitrogen fertilizer prices rose 25-50% between late February
and April across various benchmarks, as Gulf urea export capacity disruptions
removed millions of tonnes from markets.
Some shipment recovery followed interim arrangements reached
in mid-2026, though full normalization remains slow given damaged
infrastructure, with repair estimates ranging from one to four years for
fertilizer plants and longer for some gas facilities, alongside lingering
risks.
Higher natural gas and LNG costs are raising fertilizer
production expenses globally, while direct export losses are tightening
physical availability a combination that could see farmers apply less
fertilizer, lowering yields that would show up in harvests months later.
Black Sea grain flows constrained
Russia and Ukraine together account for roughly 27% of
global wheat exports in recent marketing years. Escalating attacks on ports,
terminals, and vessels since mid-2026 have heavily constrained flows during
peak post-harvest periods.
Ukrainian Black Sea deepwater ports in the Odesa region saw
capacity cuts of about one-third or more at peak periods, with seaborne
throughput falling dramatically at times near zero in August as insurers and
shipowners pulled back.
Russian terminals at Novorossiysk and Taman faced
suspensions, with over 90% of Russia's Azov-Black Sea grain export capacity
affected in some assessments. Combined monthly wheat and grain exports from the
two countries dropped sharply versus prior years, with August estimates well
below historical averages of several million tonnes.
Alternative routes via the Danube, rail, and road cannot
fully compensate for the shortfall. Carryover stocks have built up in Ukraine,
pressuring local prices, while global buyers are turning to higher-cost origins
such as Australia, Canada, and the US. USDA adjustments have reflected these
logistics constraints in lower export forecasts for both countries.
Diesel crack spreads add pressure on agriculture
Global diesel markets tightened sharply over summer 2026. US
Gulf Coast ultra-low sulfur diesel crack spreads versus WTI hit records above
$100 per barrel, with intraday highs around $102, while Northwest Europe and
Singapore cracks also stood elevated at multiples of historical norms of $20-40
in balanced markets.
Drivers include Russian refining attacks and diesel export
restrictions, Middle East disruptions via Hormuz and facility damage, lower
global refinery runs, and seasonal agricultural demand for tractors,
harvesters, and trucking.
US distillate inventories reached multi-decade lows for the
season, and retail diesel prices rose, raising costs for freight, farming
operations, and food logistics that feed into broader inflation and grocery
prices.
Sector implications
For consumers, the report recommends monitoring grocery
inflation, particularly staples and imported items such as coffee, cocoa,
sugar, and rice that are more exposed to weather and input shocks, building
modest pantry buffers where feasible, and tracking USDA and FAO price indexes.
Emerging markets face higher vulnerability given larger food shares in
household budgets.
For farmers, the focus is on input cost management nitrogen
application rates, purchase timing, and soil testing alongside close tracking
of diesel prices and local fertilizer availability, diversification of crop mix
and marketing strategies, and use of risk management tools such as crop
insurance and forward contracts.
US producers benefit from relatively stronger domestic
nitrogen access but still face global price transmission and diesel costs, with
higher input prices potentially encouraging reduced application rates that
could affect 2027 yields.
For investors, the report points to fertilizer equities and
producers with North American exposure given cheap US natural gas, agricultural
commodity futures in wheat, corn, and soy, and related logistics and refining
names.
Grain exporters from alternative origins and companies with
strong domestic fertilizer production or logistics could see relative
resilience.
Broader themes include food-security equities, farmland, and
policy-driven capacity expansions, with volatility remaining high given
geopolitics and weather. A high probability of a strong El Niño event
persisting into 2027 adds a weather premium to certain softs and grains.
US nitrogen position
The US is relatively well-positioned on nitrogen compared
with many importers. Domestic nitrogen fertilizer production roughly doubled
between 2010 and 2020 on the back of abundant low-cost natural gas, and the
country produces the large majority of its ammonia needs while pursuing ongoing
capacity expansions. Phosphate production is also significant domestically.
Overall fertilizer imports still cover around half of total
US use in recent years, however, and potash dependence remains acute, with net
import reliance above 90%, the bulk sourced from Canada, against limited
domestic output of hundreds of thousands of tonnes versus multi-million-tonne
consumption.
Nitrogen and phosphate prices have stayed elevated versus
recent years, though some nitrogen products saw relief in mid-2026.
Policy responses under the current administration include
suspending certain duties, Jones Act waivers for domestic movements,
investments through programs such as FIELDS, accelerated permitting, and
capacity growth targets for nitrogen, potash, and phosphate, with new ammonia
projects in the pipeline.
These measures aim to reduce foreign reliance over time,
though near-term global tightness continues to transmit price pressure.
The report characterizes the outlook not as a prediction of
empty shelves but of sticky higher prices stemming from delayed input effects
meeting weather risks, with markets set to continue reacting to developments
around Hormuz traffic normalization, Black Sea security, diesel inventories,
and El Niño updates.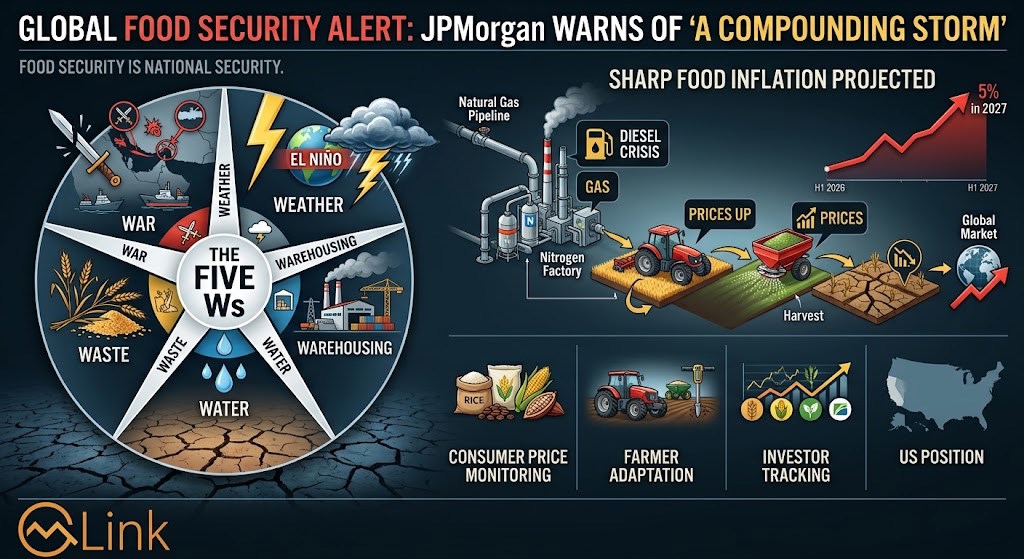
Copyright Mettis Link News
Related News



| Name | Price/Vol | %Chg/NChg |
|---|---|---|
| KSE100 | 166,186.17 175.95M | 0.46% 768.66 |
| ALLSHR | 100,823.28 516.45M | 0.48% 477.22 |
| KSE30 | 49,293.54 61.70M | 0.52% 255.05 |
| KMI30 | 240,021.93 84.31M | 0.51% 1224.01 |
| KMIALLSHR | 65,475.76 317.66M | 0.48% 313.79 |
| BKTi | 45,744.82 8.36M | 0.39% 177.09 |
| OGTi | 33,694.73 6.16M | 0.41% 138.33 |
| Symbol | Bid/Ask | High/Low |
|---|
| Name | Last | High/Low | Chg/%Chg |
|---|---|---|---|
| BITCOIN FUTURES | 82,250.00 | 82,385.00 82,095.00 | -180.00 -0.22% |
| BRENT CRUDE | 105.64 | 106.40 103.37 | -0.42 -0.40% |
| RICHARDS BAY COAL MONTHLY | 128.50 | 0.00 0.00 | 0.30 0.23% |
| ROTTERDAM COAL MONTHLY | 145.10 | 145.10 145.10 | 0.10 0.07% |
| USD RBD PALM OLEIN | 1,167.50 | 1,167.50 1,167.50 | 0.00 0.00% |
| CRUDE OIL - WTI | 97.55 | 98.32 93.58 | 2.46 2.59% |
| SUGAR #11 WORLD | 21.14 | 21.22 20.60 | 0.30 1.44% |
Chart of the Day
Latest News
Top 5 things to watch in this week
 Foreign Currency Deposits
Pakistan Stock Movers
| Name | Last | Chg/%Chg |
|---|
| Name | Last | Chg/%Chg |
|---|