Correction or Opportunity? KSE-100 Nears a Turning Point

MG News | February 26, 2026 at 10:51 AM GMT+05:00

February 26, 2026 (MLN): Markets, like nature, retreat not to surrender but to gather strength, the deeper the correction, the greater the eventual expansions.
The KSE-100 Index (163,700) appears to be approaching completion of the initial leg (Wave A) of an intermediate corrective structure, marked by a clear five-wave impulsive decline.
Price action is nearing a key structural support zone around 162,800, which coincides with oversold momentum readings (RSI in the 30 region), increasing the probability of a countertrend recovery.
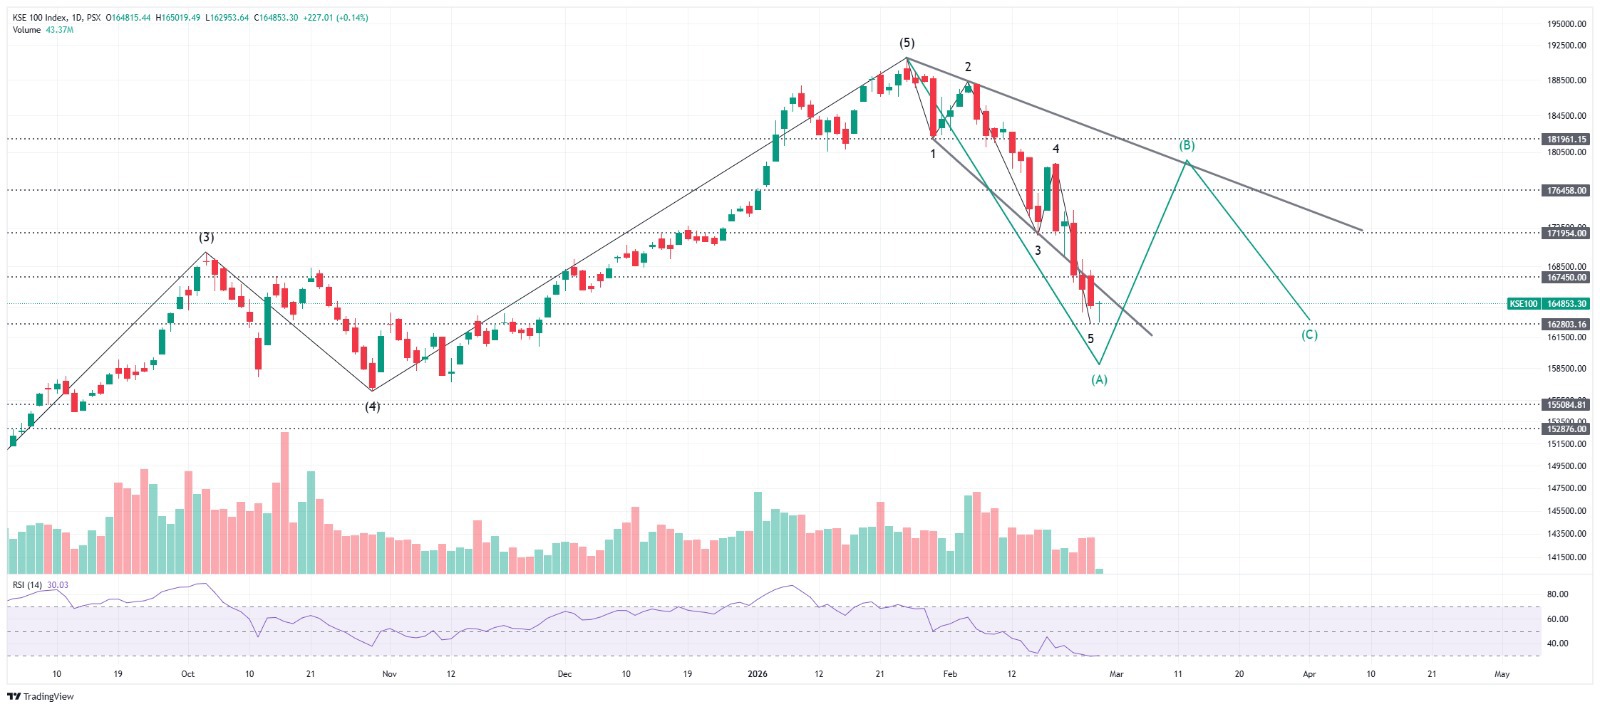
A relief rebound (Wave B) is expected to unfold in the near term, with projected retracement targets between 176,458 (minimum reaction zone) and 181,961 (upper corrective boundary). This move should primarily relieve oversold conditions rather than signal trend resumption.
Following completion of Wave B, the broader corrective sequence suggests potential continuation toward 155,100 – 152,876, which would likely mark the terminal phase (Wave C) of the intermediate correction.
From a primary degree perspective, the market appears to be undergoing a Wave 4 correction within a larger bullish cycle.
Upon completion of this corrective structure, the index retains the structural capacity to exceed the prior peak near 191,032, with long-term projections extending toward the 220,000 – 240,000 region, potentially completing a grand supercycle advance.
The broader trend remains constructive despite near-term corrective volatility.
Tactical patience is warranted while the market transitions through corrective phases before the next impulsive advance emerges.
Disclaimer:
The above analysis is based on technical observations and market interpretation at the time of writing. It is for informational and educational purposes only and does not constitute investment advice, solicitation, or an offer to buy or sell any securities.
Copyright Mettis Link News
Related News


| Name | Price/Vol | %Chg/NChg |
|---|---|---|
| KSE100 | 180,335.99 314.68M | -1.05% -1905.79 |
| ALLSHR | 109,556.66 717.74M | -0.93% -1027.02 |
| KSE30 | 53,835.58 72.58M | -1.10% -596.13 |
| KMI30 | 253,961.53 91.25M | -1.15% -2952.68 |
| KMIALLSHR | 70,297.09 468.36M | -1.05% -744.22 |
| BKTi | 51,210.02 14.85M | -0.97% -502.74 |
| OGTi | 36,269.50 6.37M | -1.06% -390.08 |
| Symbol | Bid/Ask | High/Low |
|---|
| Name | Last | High/Low | Chg/%Chg |
|---|---|---|---|
| BITCOIN FUTURES | 63,200.00 | 64,680.00 62,605.00 | -885.00 -1.38% |
| BRENT CRUDE | 77.39 | 79.80 77.31 | 1.38 1.82% |
| RICHARDS BAY COAL MONTHLY | 105.75 | 0.00 0.00 | -1.15 -1.08% |
| ROTTERDAM COAL MONTHLY | 118.00 | 0.00 0.00 | 0.65 0.55% |
| USD RBD PALM OLEIN | 1,135.00 | 1,135.00 1,135.00 | 0.00 0.00% |
| CRUDE OIL - WTI | 72.72 | 75.08 72.65 | 1.31 1.83% |
| SUGAR #11 WORLD | 14.70 | 14.98 14.65 | -0.18 -1.21% |
Chart of the Day
Latest News
Top 5 things to watch in this week
Pakistan Stock Movers
| Name | Last | Chg/%Chg |
|---|
| Name | Last | Chg/%Chg |
|---|