SGF reports 64% drop in quarterly earnings
By MG News | August 26, 2024 at 10:19 AM GMT+05:00
August 26, 2024 (MLN): Service GlobalFootwear Limited (PSX: SGF) earnings during the quarter ended June 30, 2024, fell over 64% to Rs65.13 million [EPS: Rs0.32] compared to a profit of Rs181.03m [EPS: Rs0.89] recorded in the same period last year (SPLY).
According to the results, the company's top line fell by 1.8% to Rs3.77bn compared to Rs3.84bn in SPLY.
On the other hand, the cost of sales rose by 7.3%, which further worsened the gross profit by 31.9% to Rs602.4m in Q2 2024.
The gross margins worsened to 16% as compared to 23.1% in SPLY.
On the expense side, the company's administrative expenses and selling and distribution expenses rose by 17.6% and 11.4% YoY, respectively.
Meanwhile, other operating expenses fell 81.2% YoY to Rs4.53m.
During the period under review, other income also went down by 51.8% to stand at Rs108.08m in Q2 2024 as compared to Rs224.08m in SPLY, further worsening SGF's situation.
Conversely, the company's inflow through Equity Accounted Investee recorded a massive surge of 466.85%, rising to Rs230.16m in Q2 2024.
The company’s finance cost marked a decline of 40.4% and stood at Rs174.42m as compared to Rs292.65m in SPLY.
On the tax front, the company paid a higher tax worth Rs174.1m against the Rs93.92m paid in the corresponding period of last year, depicting an increase of 85.4%.
| Consolidated (un-audited) Financial Results for quarter ended June 30, 2024 (Rupees in '000) | |||
|---|---|---|---|
| Jun 24 | Jun 23 | % Change | |
| Sales | 3,767,488 | 3,835,012 | -1.76% |
| Cost of sales | (3,165,084) | (2,950,225) | 7.28% |
| Gross Profit/ (loss) | 602,404 | 884,787 | -31.92% |
| Administrative Expenses | (181,816) | (154,607) | 17.60% |
| Selling And Distribution Expenses | (354,145) | (317,820) | 11.43% |
| Share of Profit/(Loss) of Equity Accounted Investee - Net of Tax | 230,159 | 40,603 | 466.85% |
| Other Income | 108,078 | 224,080 | -51.77% |
| Other Operating Expenses | (4,527) | (24,036) | -81.17% |
| Finance Cost | (174,424) | (292,650) | -40.40% |
| Profit/ (loss) before taxation | 239,230 | 274,951 | -12.99% |
| Taxation | (174,102) | (93,920) | 85.37% |
| Net profit/ (loss) for the period | 65,128 | 181,031 | -64.02% |
| Basic earnings/ (loss) per share | 0.32 | 0.89 | - |
Amount in thousand except for EPS
Copyright Mettis Link News
Related News


| Name | Price/Vol | %Chg/NChg |
|---|---|---|
| KSE100 | 131,949.07 198.95M |
0.97% 1262.41 |
| ALLSHR | 82,069.26 730.83M |
0.94% 764.01 |
| KSE30 | 40,387.76 80.88M |
1.11% 442.31 |
| KMI30 | 191,376.82 77.76M |
0.36% 678.77 |
| KMIALLSHR | 55,193.97 350.11M |
0.22% 119.82 |
| BKTi | 35,828.25 28.42M |
3.64% 1259.85 |
| OGTi | 28,446.34 6.84M |
-1.02% -293.01 |
| Symbol | Bid/Ask | High/Low |
|---|
| Name | Last | High/Low | Chg/%Chg |
|---|---|---|---|
| BITCOIN FUTURES | 108,125.00 | 110,525.00 107,865.00 |
-2290.00 -2.07% |
| BRENT CRUDE | 68.51 | 68.89 67.75 |
-0.29 -0.42% |
| RICHARDS BAY COAL MONTHLY | 97.50 | 0.00 0.00 |
0.75 0.78% |
| ROTTERDAM COAL MONTHLY | 106.00 | 106.00 105.85 |
-2.20 -2.03% |
| USD RBD PALM OLEIN | 998.50 | 998.50 998.50 |
0.00 0.00% |
| CRUDE OIL - WTI | 66.50 | 67.18 66.04 |
-0.50 -0.75% |
| SUGAR #11 WORLD | 16.37 | 16.40 15.44 |
0.79 5.07% |
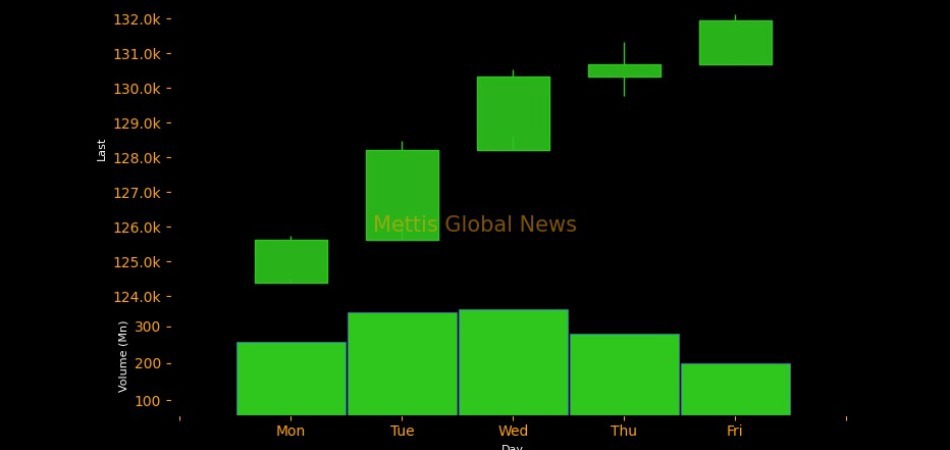
Chart of the Day
Latest News
Top 5 things to watch in this week
Pakistan Stock Movers
| Name | Last | Chg/%Chg |
|---|
| Name | Last | Chg/%Chg |
|---|