Samba Bank records 2.87x increase in net profits for 9MCY23

MG News | October 26, 2023 at 03:53 PM GMT+05:00

October 26, 2023 (MLN): Samba Bank Limited (PSX: SBL) announced its results for the nine months of 2023 where the bank’s net profits soared by 2.87x to Rs1.06 billion [EPS: Rs1.05] compared to Rs369.35m [EPS: Rs0.37] in the same period last year (SPLY).
Going by the income statement made available by the company on the PSX, the bank witnessed an increase of 80.25% YoY in its markup interest income to clock in at Rs5.73bn against Rs3.12bn in the same period last year (SPLY).
On the other hand, the bank’s total non-markup interest income declined by 23.64% YoY to Rs847.27m as compared to Rs1.11bn in SPLY.
This was due to a massive loss on securities of Rs465.7m. In addition, the dividend income also declined by 30% YoY in 9MCY23.
Accordingly, the bank’s total income was recorded at Rs6.57bn as against Rs4.29bn in SPLY.
The nine months’ total non-mark-up/interest expenses stood at Rs3.46bn, up by 15.92% YoY.
On the taxation front, the company paid Rs792m, more than three times YoY higher than the Rs256m paid in SPLY.
| Unconsolidated (un-audited) Financial Results for Nine months ended 30 September, 2023 (Rupees in '000) | |||
|---|---|---|---|
| Sep-23 | Sep-22 | % Change | |
| Mark-up/return/interest earned | 21,200,792 | 15,769,769 | 34.44% |
| Mark-up/return/interest expensed | 15,475,308 | 12,593,278 | 22.89% |
| Mark-up/return/interest income | 5,725,484 | 3,176,491 | 80.25% |
| NON MARK-UP/INTEREST INCOME | |||
| Fee and commission income | 298,690 | 300,216 | -0.51% |
| Dividend income | 27,046 | 38,597 | -29.93% |
| Foreign exchange income | 975,044 | 917,788 | 6.24% |
| Income / (loss) from derivatives | |||
| Gain / (loss) on securities | (465,696) | (159,511) | 191.95% |
| Other income | 12,187 | 12,499 | -2.50% |
| Total non mark-up/interest income | 847,271 | 1,109,589 | -23.64% |
| Total Income | 6,572,755 | 4,286,080 | 53.35% |
| NON MARK-UP/INTEREST EXPENSES | |||
| Operating expenses | 3,422,281 | 2,970,091 | 15.22% |
| Workers' Welfare Fund | 37,000 | 12,800 | 189.06% |
| Other charges | 1,303 | -100.00% | |
| Total non mark-up/interest expenses | 3,459,281 | 2,984,194 | 15.92% |
| Profits before provisions | 3,113,474 | 1,301,886 | 139.15% |
| (Provisions) / reversal and write offs - net | (1,261,221) | (676,524) | 86.43% |
| Extraordinary items/unusual items | - | - | |
| Profit before taxation | 1,852,253 | 625,362 | 196.19% |
| Taxation | (791,977) | (256,009) | 209.36% |
| Profit after taxation | 1,060,276 | 369,353 | 187.06% |
| Earning per share - basic (Rupees) | 1.05 | 0.37 | 183.78% |
Amount in thousand except for EPS
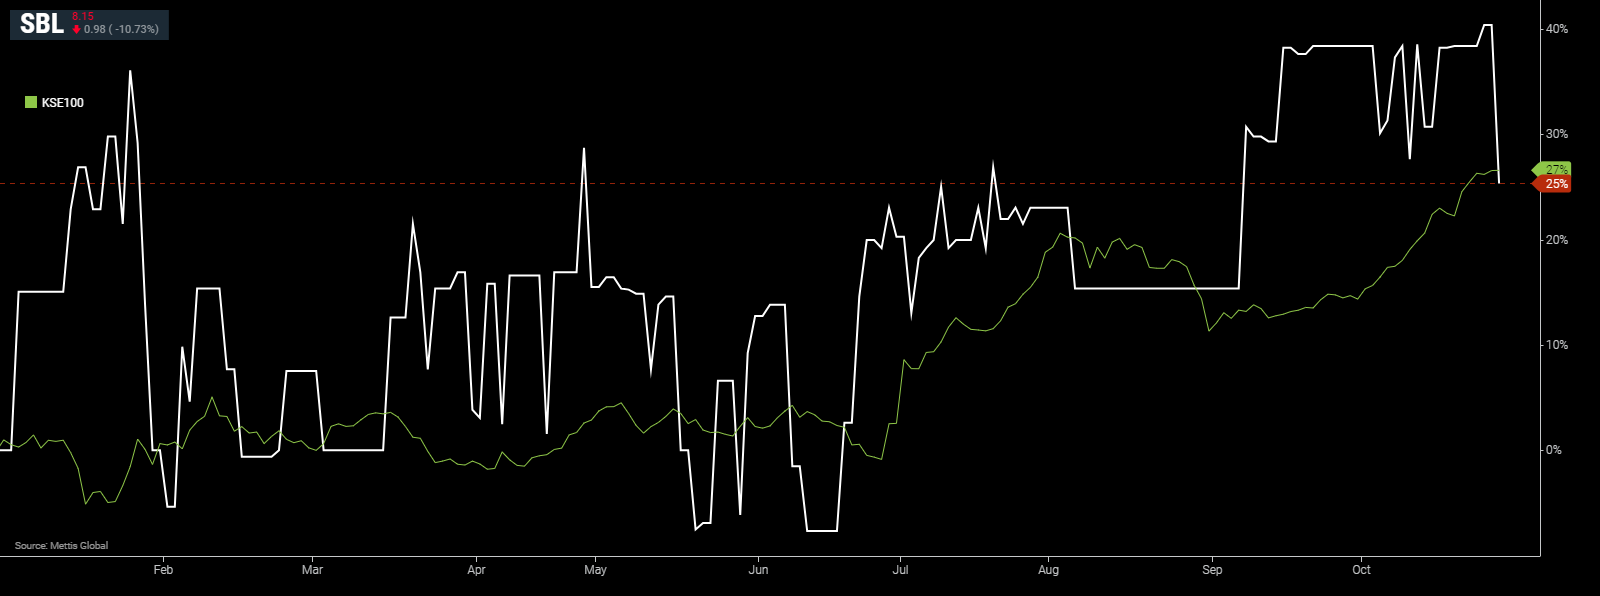
SBL and KSE-100 YTD Performance
Copyright Mettis Link News
Related News


| Name | Price/Vol | %Chg/NChg |
|---|---|---|
| KSE100 | 171,725.29 261.56M | 2.31% 3881.05 |
| ALLSHR | 103,214.49 498.64M | 2.00% 2024.02 |
| KSE30 | 51,517.14 135.33M | 2.40% 1209.13 |
| KMI30 | 246,565.71 111.44M | 2.29% 5524.54 |
| KMIALLSHR | 67,042.77 274.55M | 1.94% 1273.86 |
| BKTi | 47,299.71 43.26M | 3.04% 1394.54 |
| OGTi | 36,341.37 10.64M | 2.20% 783.44 |
| Symbol | Bid/Ask | High/Low |
|---|
| Name | Last | High/Low | Chg/%Chg |
|---|---|---|---|
| BITCOIN FUTURES | 76,720.00 | 77,935.00 76,105.00 | 945.00 1.25% |
| BRENT CRUDE | 100.06 | 100.07 97.12 | 3.92 4.08% |
| RICHARDS BAY COAL MONTHLY | 110.00 | 0.00 0.00 | -8.75 -7.37% |
| ROTTERDAM COAL MONTHLY | 111.10 | 111.10 111.10 | 0.35 0.32% |
| USD RBD PALM OLEIN | 1,157.50 | 1,157.50 1,157.50 | 0.00 0.00% |
| CRUDE OIL - WTI | 93.55 | 93.90 89.41 | -3.05 -3.16% |
| SUGAR #11 WORLD | 14.54 | 14.63 14.44 | -0.16 -1.09% |
Chart of the Day
Latest News
Top 5 things to watch in this week
Pakistan Stock Movers
| Name | Last | Chg/%Chg |
|---|
| Name | Last | Chg/%Chg |
|---|