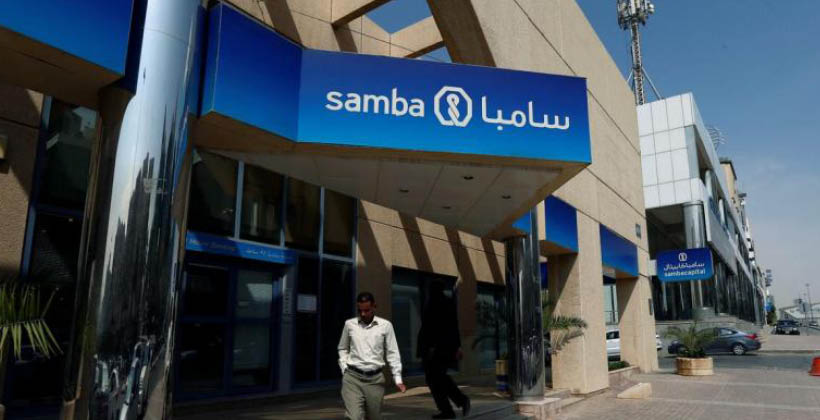
Samba Bank Q3 profit drops 71% amid lower markup income

MG News | October 30, 2024 at 11:24 AM GMT+05:00
October 30, 2024 (MLN): Samba Bank Limited (PSX: SBL) earned Rs103.66m [EPS: Rs0.1] during the quarter ended September 30, 2024 (Q3 CY24) compared to a profit of Rs354.23m [EPS: Rs0.35] recorded in Q3 2023, reflecting a significant drop of 70.74%.
It is crucial to note that SBL swung to a profit in 2023, as its net profit reached Rs1.24bn compared to a loss of Rs427.94m recorded in 2022.
Going by the income statement made available by the company on the PSX, the bank saw its markup interest income drop 21.84% to Rs1.69bn in Q3 CY24.
Conversely, the bank’s total non-markup interest income increased 5.05% to Rs426.9m as compared to Rs406.39m reported in Q3 CY23.
Accordingly, the bank’s total income was recorded at Rs2.11bn as against Rs2.57bn in SPLY, reflecting a drop of 17.58%.
The three months’ total non-mark-up/interest expenses of SBL stood at Rs1.29bn, up by 7.71%.
SBL's net credit loss allowance and write-offs dropped 7.27% to be recorded at Rs620.46m during this review quarter.
On the tax front, the bank paid Rs98.58m, against a tax expense of Rs343m reported in Q3 CY23.
| Profit and Loss Account for the quarter ended September 30, 2024 ('000 Rupees) | |||
|---|---|---|---|
| Sep-24 | Sep-23 | % Change | |
| Mark-up/return/interest earned | 7,238,282 | 7,393,256 | -2.10% |
| Mark-up/return/interest expensed | 5,550,281 | 5,233,626 | 6.05% |
| Mark-up/return/interest expensed | 1,688,001 | 2,159,630 | -21.84% |
| NON MARK-UP/INTEREST INCOME | |||
| Fee and commission income | 94,430 | 99,802 | -5.38% |
| Dividend income | 14,862 | 10,309 | 44.17% |
| Foreign exchange income | 223,620 | 243,780 | -8.27% |
| Income / (loss) from derivatives | - | - | - |
| Gain / (loss) on securities | 93,518 | 49,543 | - |
| Other income | 467 | 2,957 | -99.89% |
| Total non mark-up/interest income | 426,897 | 406,391 | 5.05% |
| Total Income | 2,114,898 | 2,566,021 | -17.58% |
| NON MARK-UP/INTEREST EXPENSES | |||
| Operating expenses | 1,292,195 | 1,188,697 | 8.71% |
| Workers' Welfare Fund | - | 11,000 | - |
| Other charges | - | - | - |
| Total non mark-up/interest expenses | 1,292,195 | 1,199,697 | 7.71% |
| profit before provisions | 822,703 | 1,366,324 | -39.79% |
| Credit loss allowance / reversals and write offs-net | -620,460 | -669,094 | -7.27% |
| Extraordinary items/unusual items | - | - | |
| Profit before taxation | 202,243 | 697,230 | -70.99% |
| Taxation | -98,580 | -343,000 | -71.26% |
| Profit after taxation | 103,663 | 354,230 | -70.74% |
| earnings per share - basic (Rupees) | 0.1 | 0.35 | - |
Copyright Mettis Link News
Related News
| Name | Price/Vol | %Chg/NChg |
|---|---|---|
| KSE100 | 138,597.36 256.32M | -0.05% -68.14 |
| ALLSHR | 85,286.16 608.38M | -0.48% -413.35 |
| KSE30 | 42,340.81 77.13M | -0.03% -12.33 |
| KMI30 | 193,554.51 76.19M | -0.83% -1627.52 |
| KMIALLSHR | 55,946.05 305.11M | -0.79% -443.10 |
| BKTi | 38,197.97 16.53M | -0.59% -225.01 |
| OGTi | 27,457.35 6.73M | -0.94% -260.91 |
| Symbol | Bid/Ask | High/Low |
|---|
| Name | Last | High/Low | Chg/%Chg |
|---|---|---|---|
| BITCOIN FUTURES | 117,670.00 | 121,165.00 117,035.00 | -1620.00 -1.36% |
| BRENT CRUDE | 69.23 | 70.77 69.14 | -0.29 -0.42% |
| RICHARDS BAY COAL MONTHLY | 96.50 | 0.00 0.00 | 2.20 2.33% |
| ROTTERDAM COAL MONTHLY | 104.50 | 104.50 104.50 | -0.30 -0.29% |
| USD RBD PALM OLEIN | 998.50 | 998.50 998.50 | 0.00 0.00% |
| CRUDE OIL - WTI | 66.03 | 67.54 65.93 | -0.20 -0.30% |
| SUGAR #11 WORLD | 16.79 | 17.02 16.71 | 0.05 0.30% |
Chart of the Day
Latest News
Top 5 things to watch in this week
Pakistan Stock Movers
| Name | Last | Chg/%Chg |
|---|
| Name | Last | Chg/%Chg |
|---|


 Weekly Forex Reserves