Power generation drops 13.7% YoY in April 2024

MG News | May 22, 2024 at 10:42 PM GMT+05:00

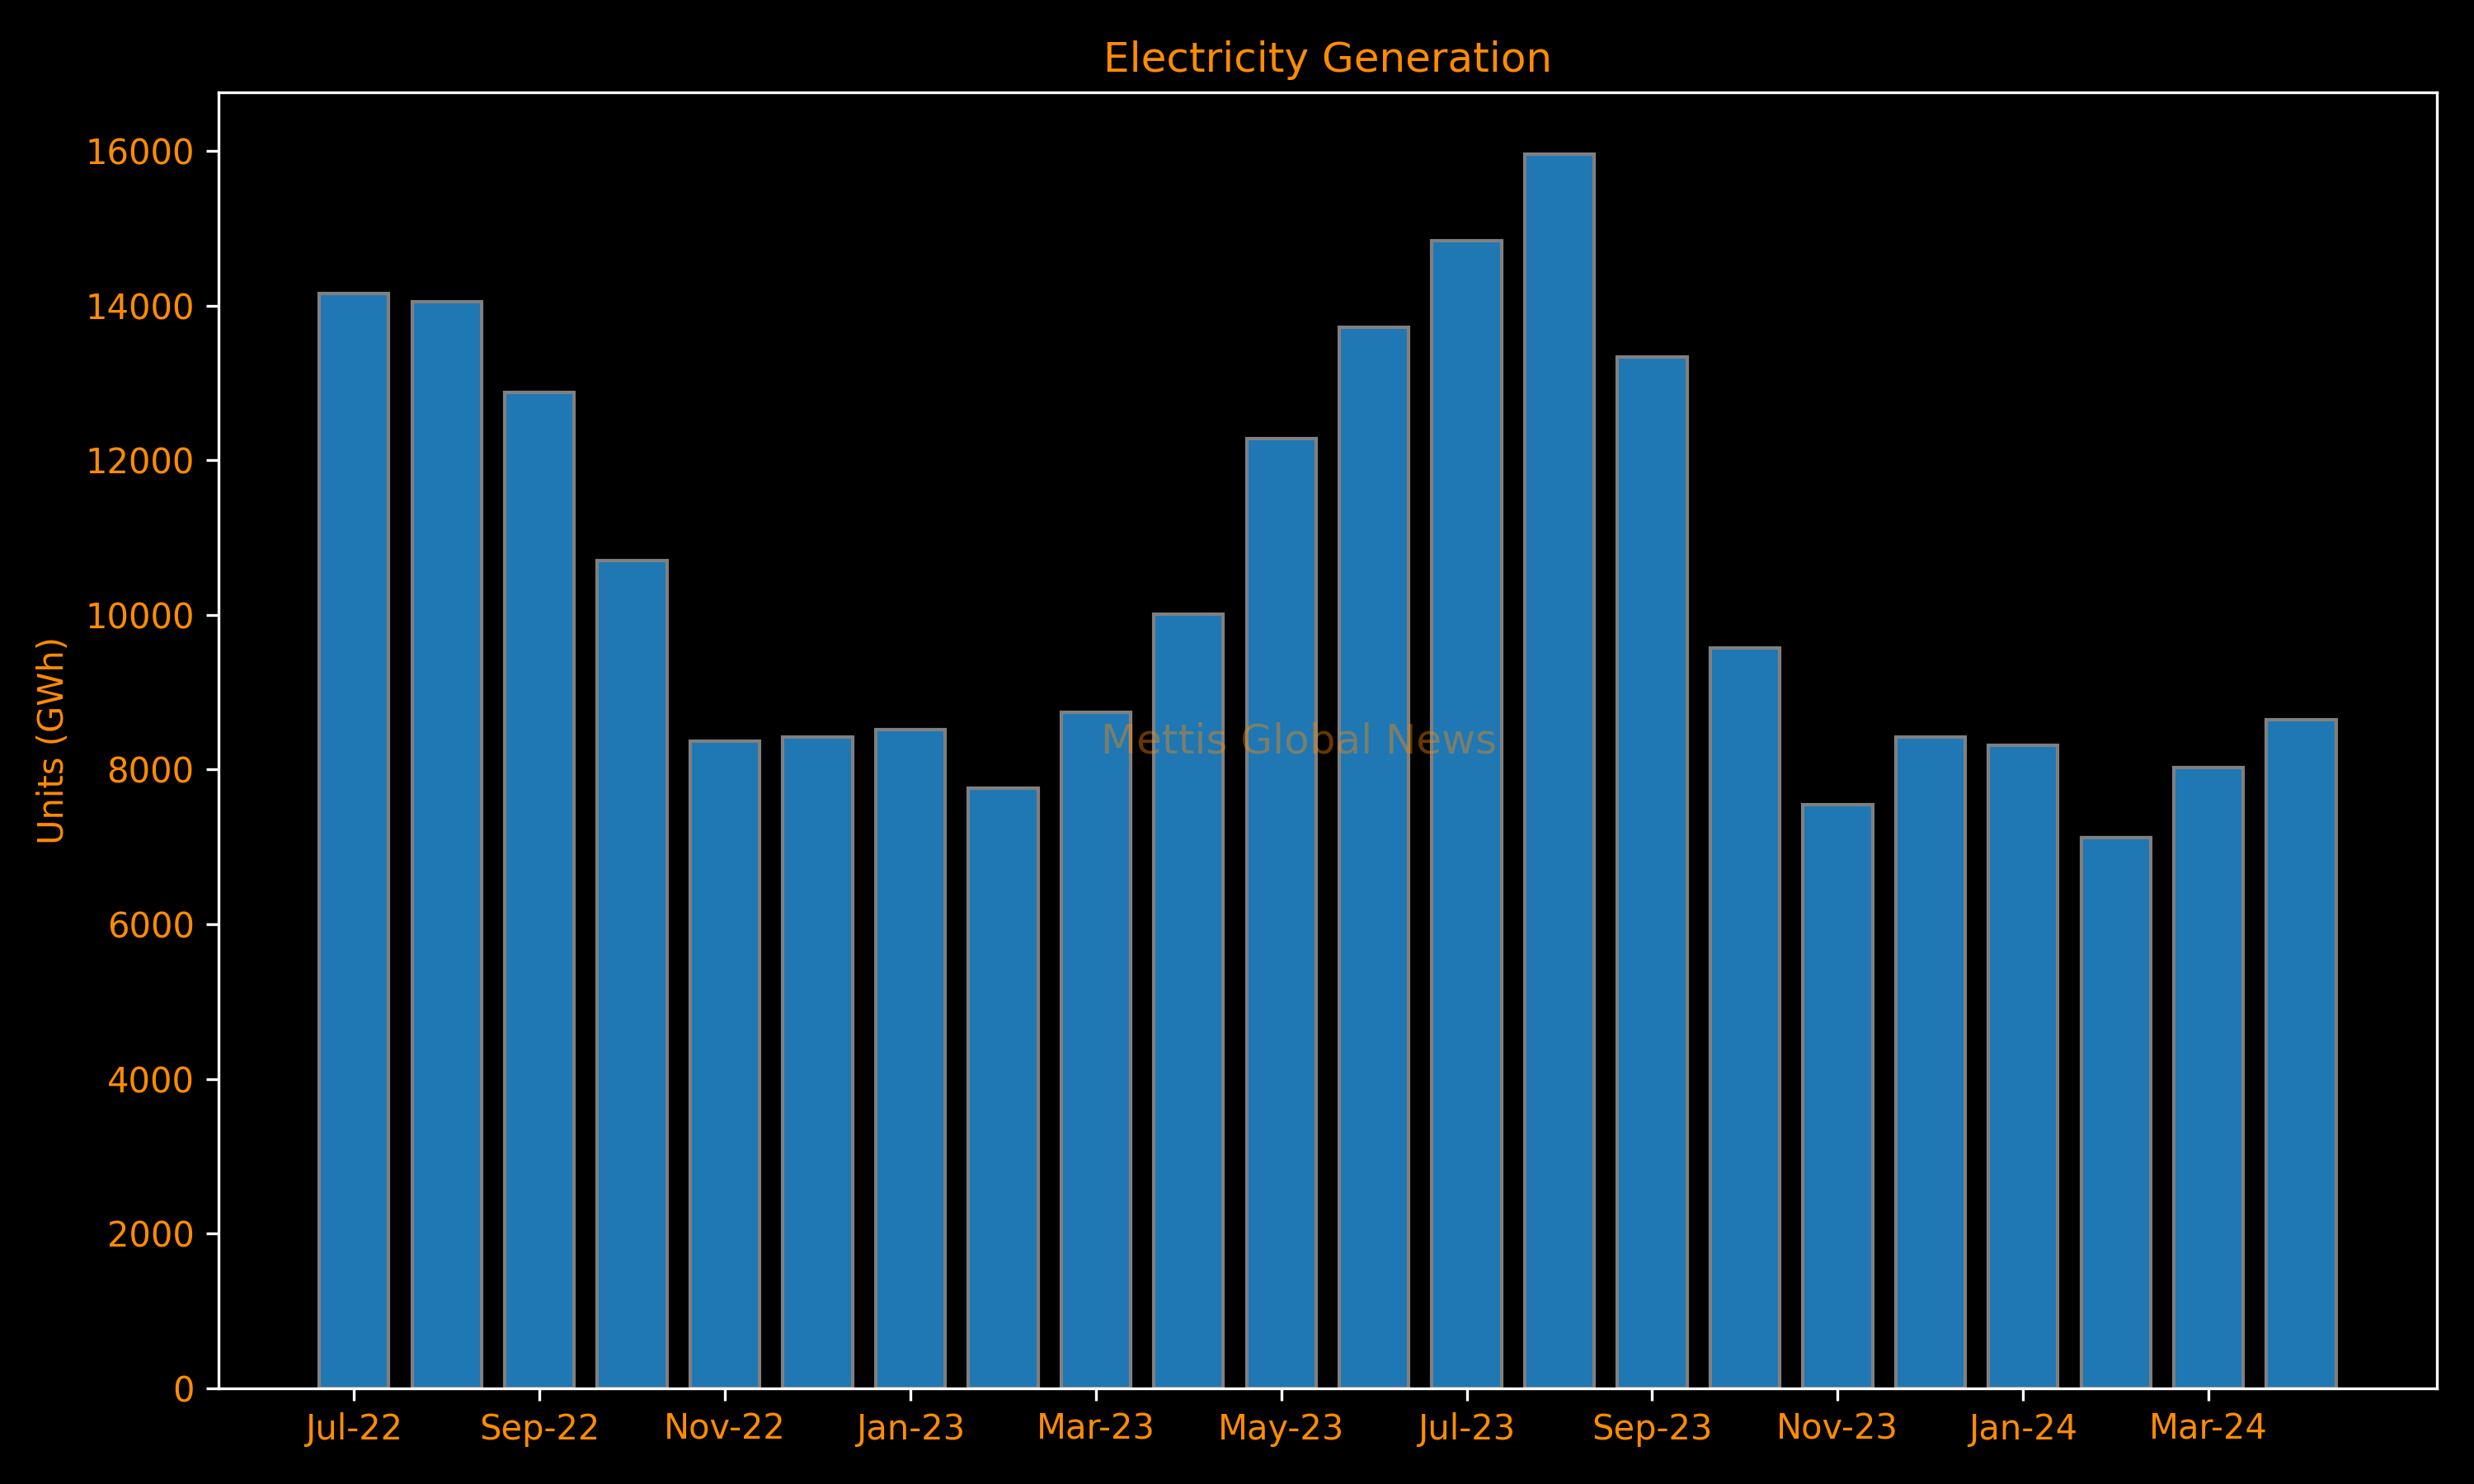
May 22, 2024 (MLN): The total power generation in the country decreased by 13.7% YoY to 8,640 GWh during April 2024 as compared to 10,010 GWh in the same month of last year.
According to the monthly electricity generation data released by National Electric Power Authority (NEPRA), the total power generation increased by 7.7% MoM compared to 8,023 GWh in March 2024.
On a cumulative basis, in 10MFY24, electricity generation stood at 101,764 GWh, down 1.8% YoY compared to the generation of 103,593 in 10MFY23.
The average fuel cost for power generation declined by 10.1% YoY to Rs9.21/KWh in April 2024 compared to Rs10.24/KWh during April 2023.
On a monthly basis, fuel cost rose by 10.8%.
Generation through Coal, Gas, RLNG, Wind, Bagasse, and Solar registered a year-on-year decrease of 50.4%, 18%, 10.8%, 11.1%, 31%, and 10.2% respectively in April, compared with the figures in same month of last year.
On the other hand, production of Hydel, Nuclear, and Import from Iran jumped by 10.6%, 6.6%, and 21.5% YoY, respectively.
Share-wise, RLNG held the majority share of electricity generation during the month, clocking in at 25.0%
This was followed by Hydel with 24.0%, Nuclear with 23.6%, Gas with 11.3%, and Coal with 10.4%.
Cumulatively, Hydel took the lead in electricity generation with a share of 30.6% in 10MFY24. Nuclear followed at 19.3%, with RLNG contributing 18.1%, Coal at 15.9%, and Gas at 9.4%.
| Units (GWh) | Apr-24 | Apr-23 | YoY % | Mar-24 | MoM % | 10MFY24 | 10MFY23 | Cumulative % |
|---|---|---|---|---|---|---|---|---|
| Total | 8,640 | 10,010 | -13.7% | 8,023 | 7.7% | 101,764 | 103,593 | -1.8% |
| Hydel | 2,070 | 1,872 | 10.6% | 2,217 | -6.6% | 31,099 | 28,809 | 7.9% |
| Coal | 902 | 1,819 | -50.4% | 862 | 4.7% | 16,166 | 16,254 | -0.5% |
| HSD | 0 | 0 | - | 0 | - | 102 | 206 | -50.6% |
| RFO | 0 | 223 | -100.0% | 0 | - | 1,973 | 4,020 | -50.9% |
| Gas | 975 | 1,189 | -18.0% | 795 | 22.6% | 9,612 | 12,038 | -20.2% |
| RLNG | 2,157 | 2,418 | -10.8% | 1,658 | 30.1% | 18,456 | 16,656 | 10.8% |
| Nuclear | 2,043 | 1,916 | 6.6% | 2,070 | -1.3% | 19,617 | 20,655 | -5.0% |
| Import from Iran | 37 | 30 | 21.5% | 28 | 30.4% | 292 | 420 | -30.5% |
| Mixed | 0 | 13 | -100.0% | 0 | - | 2 | 96 | -97.7% |
| Wind | 287 | 323 | -11.1% | 205 | 40.2% | 3,041 | 2,892 | 5.2% |
| Bagasse | 56 | 81 | -31.0% | 79 | -28.7% | 610 | 704 | -13.3% |
| Solar | 113 | 126 | -10.2% | 110 | 2.7% | 794 | 844 | -5.9% |
Source: NEPRA, SBP
Copyright Mettis Link News
Related News
.png?width=280&height=140&format=Webp)


| Name | Price/Vol | %Chg/NChg |
|---|---|---|
| KSE100 | 171,021.20 228.53M | -0.42% -718.25 |
| ALLSHR | 103,836.39 572.65M | -0.41% -422.85 |
| KSE30 | 50,951.99 89.47M | -0.52% -264.77 |
| KMI30 | 240,633.87 93.99M | -0.31% -756.80 |
| KMIALLSHR | 66,572.75 300.61M | -0.28% -185.59 |
| BKTi | 48,673.23 31.18M | -0.70% -343.86 |
| OGTi | 33,702.25 6.35M | -0.61% -205.57 |
| Symbol | Bid/Ask | High/Low |
|---|
| Name | Last | High/Low | Chg/%Chg |
|---|---|---|---|
| BITCOIN FUTURES | 65,000.00 | 65,570.00 63,875.00 | 785.00 1.22% |
| BRENT CRUDE | 92.58 | 93.60 89.58 | -4.20 -4.34% |
| RICHARDS BAY COAL MONTHLY | 105.75 | 0.00 0.00 | -1.55 -1.44% |
| ROTTERDAM COAL MONTHLY | 121.10 | 0.00 0.00 | 0.85 0.71% |
| USD RBD PALM OLEIN | 1,175.00 | 1,175.00 1,175.00 | 0.00 0.00% |
| CRUDE OIL - WTI | 85.17 | 86.20 83.10 | -4.14 -4.64% |
| SUGAR #11 WORLD | 14.76 | 0.00 0.00 | -0.01 -0.07% |
Chart of the Day
Latest News
Top 5 things to watch in this week
Pakistan Stock Movers
| Name | Last | Chg/%Chg |
|---|
| Name | Last | Chg/%Chg |
|---|