Pakistan’s GDP likely to grow at only 0.29% in FY23

MG News | May 25, 2023 at 10:10 AM GMT+05:00
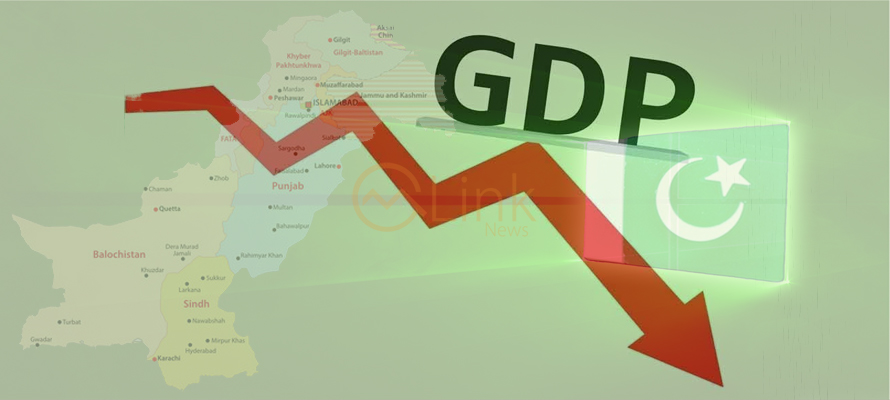
May 25, 2023 (MLN): Pakistan’s provisional GDP growth rate for the year 2022-23 is estimated at 0.29%, National Accounts Committee said in its 106th meeting to review the final, revised and provisional estimates of Gross Domestic Product (GDP) for the years 2021-22 and 2022-23 respectively.
The meeting was held today in the Auditorium of the Ministry of Planning Development & Special Initiatives (MoPD&SI), P-Block Islamabad.
The Secretary, MoPD&SI chaired the meeting. The provisional GDP estimates for the year 2021-22 presented in the 105th meeting of the NAC held in 2022 have been updated on the basis of the latest available data.
The final growth rate of GDP for the year 2021-22 has been estimated at 5.77% which was 5.74%. The revised growth rate of GDP for the year 2021-22 is 6.10% which was provisionally estimated at 5.97%.
The provisional growth rate of GDP for the year 2022-23 is estimated at 0.29%. The growth of agricultural, manufacturing, commodity-producing sector, and services sector is 1.55%, -3.91%, -0.51%, and 0.86% respectively.
The growth of important crops during this year is -3.2% due to a decrease in the production of Cotton, which is down 41% from 8.33 million bales to 4.91m bales, and Rice which is down 21.5%, from 9.32m tons to 7.32m tons.
However, positive growth has been observed in wheat, which is up 5.4% from 26.208m tons to 27.634m tons, sugarcane which is up 2.8% from 88.65m tons to 91.11m tons, and Maize which is up 6.9% from 9.52m tons to 10.183m tons.
Other crops have posted a modest growth of 0.23% due to a slight increase in the production of pulses, vegetables, fodder, oil seeds, and fruits.
The provisional growth in livestock, forestry and fishing is 3.78%, 3.93% and 1.44% respectively.
The overall industrial sector shows a decrease of 2.94%. The mining and quarrying sector has decreased by 4.41% due to a decline in the production of other minerals as well as a decline in exploration costs.
The Large-Scale Manufacturing industry is driven primarily by QIM data, which has posted a negative growth of 7.98%.
Major contributors to this decline in growth are Food (-8.71%), Tobacco (-23.78%), Textile (-16.03%), Coke and Petroleum Products (-10.24%), Chemicals (-6.29%), Pharmaceuticals (-23.20%), Fertilizers (-9.54%), Non-metallic products which includes cement (-10.75%), Iron & Steel Products (-4.02%), Electrical equipment (-11.15%), Automobiles (-46.01%) and other transport equipment (-38.91%).
Electricity, gas and water industry shows a growth of 6.03% mainly due to higher output reported by the sources.
The value added in the construction industry, mainly driven by construction-related expenditures by industries, has registered a negative growth of 5.53% mainly due to conservative reporting of construction-related expenditure by private as well as public sector enterprises and unusual increase in relevant deflator i.e. WPI building material.
The services sector shows a slow growth of 0.86%.
Wholesale and Retail Trade industry declined by 4.46% due to a decline in the output of crops (-4.57%), LSM (-8.11%) and imports (-12.68%).
Transportation & Storage industry has increased by 4.73% whereas accommodation and food services activities have grown by 4.11%. Information and communication increased by 6.93% due to increase in telecommunication.
Finance and insurance industry shows an overall decrease of -3.82% mainly due to high CPI based deflator (26%).
Real estate activities grew by 3.72% while public administration and social security (general government) activities posted a negative growth of 7.76% due to high deflator.
Education has witnessed a growth of 10.44% due to public sector expenditure.
Human health and social work activities also increased by 8.49% due to general government. The provisional growth in other private services is 5.0%.
|
Gross Domestic Product of Pakistan (at constant basic prices of 2015-16) (Rs in Million) |
|||
|---|---|---|---|
|
S. |
Sector/Industry |
2021-22/ |
2022-23 / |
|
2020-21 |
2021-22 |
||
|
A |
Agriculture, Forestry and Fishing ( 1 to 4 ) |
4.27 |
1.55 |
|
|
1. Crops ( i+ii+iii) |
8.19 |
-2.49 |
|
|
i) Important Crops |
5.41 |
-3.20 |
|
|
ii) Other Crops |
11.93 |
0.23 |
|
|
iii) Cotton Ginning |
9.22 |
-23.01 |
|
|
2. Livestock |
2.25 |
3.78 |
|
|
3. Forestry |
4.07 |
3.93 |
|
|
4. Fishing |
0.35 |
1.44 |
|
B |
Industrial Activities ( 1 to 4 ) |
6.83 |
-2.94 |
|
|
1. Mining and Quarrying |
-7.00 |
-4.41 |
|
|
2. Manufacturing ( i+ii+iii) |
10.86 |
-3.91 |
|
|
i) Large Scale |
11.90 |
-7.98 |
|
|
ii) Small Scale |
8.90 |
9.03 |
|
|
iii) Slaughtering |
6.29 |
6.31 |
|
|
3 Electricity, Gas and Water supply |
3.14 |
6.03 |
|
|
4. Construction |
1.90 |
-5.53 |
|
|
Commodity Producing Activities (A+B) |
5.43 |
-0.51 |
|
C |
Services ( 1 to 10) |
6.59 |
0.86 |
|
|
1. Wholesale & Retail trade |
10.32 |
-4.46 |
|
|
2. Transportation & Storage |
4.09 |
4.73 |
|
|
3. Accommodation and Food Services Activities (Hotels & Restaurants) |
4.08 |
4.11 |
|
|
4. Information and Communication |
16.32 |
6.93 |
|
|
5. Financial and Insurance Activities |
7.18 |
-3.82 |
|
|
6. Real Estate Activities (OD) |
3.69 |
3.72 |
|
|
7. Public Administration and Social Security (General Government) |
1.81 |
-7.76 |
|
|
8. Education |
5.66 |
10.44 |
|
|
9. Human Health and Social Work Activities |
2.68 |
8.49 |
|
|
10. Other Private Services |
4.77 |
5.00 |
|
D |
GDP {Total of GVA at bp (A+B+C) |
6.10 |
0.29 |
Copyright Mettis Link News
Related News
| Name | Price/Vol | %Chg/NChg |
|---|---|---|
| KSE100 | 134,299.77 290.06M |
0.39% 517.42 |
| ALLSHR | 84,018.16 764.12M |
0.48% 402.35 |
| KSE30 | 40,814.29 132.59M |
0.33% 132.52 |
| KMI30 | 192,589.16 116.24M |
0.49% 948.28 |
| KMIALLSHR | 56,072.25 387.69M |
0.32% 180.74 |
| BKTi | 36,971.75 19.46M |
-0.05% -16.94 |
| OGTi | 28,240.28 6.19M |
0.21% 58.78 |
| Symbol | Bid/Ask | High/Low |
|---|
| Name | Last | High/Low | Chg/%Chg |
|---|---|---|---|
| BITCOIN FUTURES | 118,140.00 | 119,450.00 115,635.00 |
4270.00 3.75% |
| BRENT CRUDE | 70.63 | 70.71 68.55 |
1.99 2.90% |
| RICHARDS BAY COAL MONTHLY | 97.50 | 0.00 0.00 |
1.10 1.14% |
| ROTTERDAM COAL MONTHLY | 108.75 | 108.75 108.75 |
0.40 0.37% |
| USD RBD PALM OLEIN | 998.50 | 998.50 998.50 |
0.00 0.00% |
| CRUDE OIL - WTI | 68.75 | 68.77 66.50 |
2.18 3.27% |
| SUGAR #11 WORLD | 16.56 | 16.60 16.20 |
0.30 1.85% |
Chart of the Day
Latest News
Top 5 things to watch in this week
Pakistan Stock Movers
| Name | Last | Chg/%Chg |
|---|
| Name | Last | Chg/%Chg |
|---|


 MTB Auction