Is Pakistan stock rally overheating?

Abdur Rahman | November 10, 2024 at 08:41 PM GMT+05:00

November 11, 2024 (MLN): Pakistan stocks may be in the final leg of the rally as technical indicators show the market is approaching most overheated levels in over a decade.
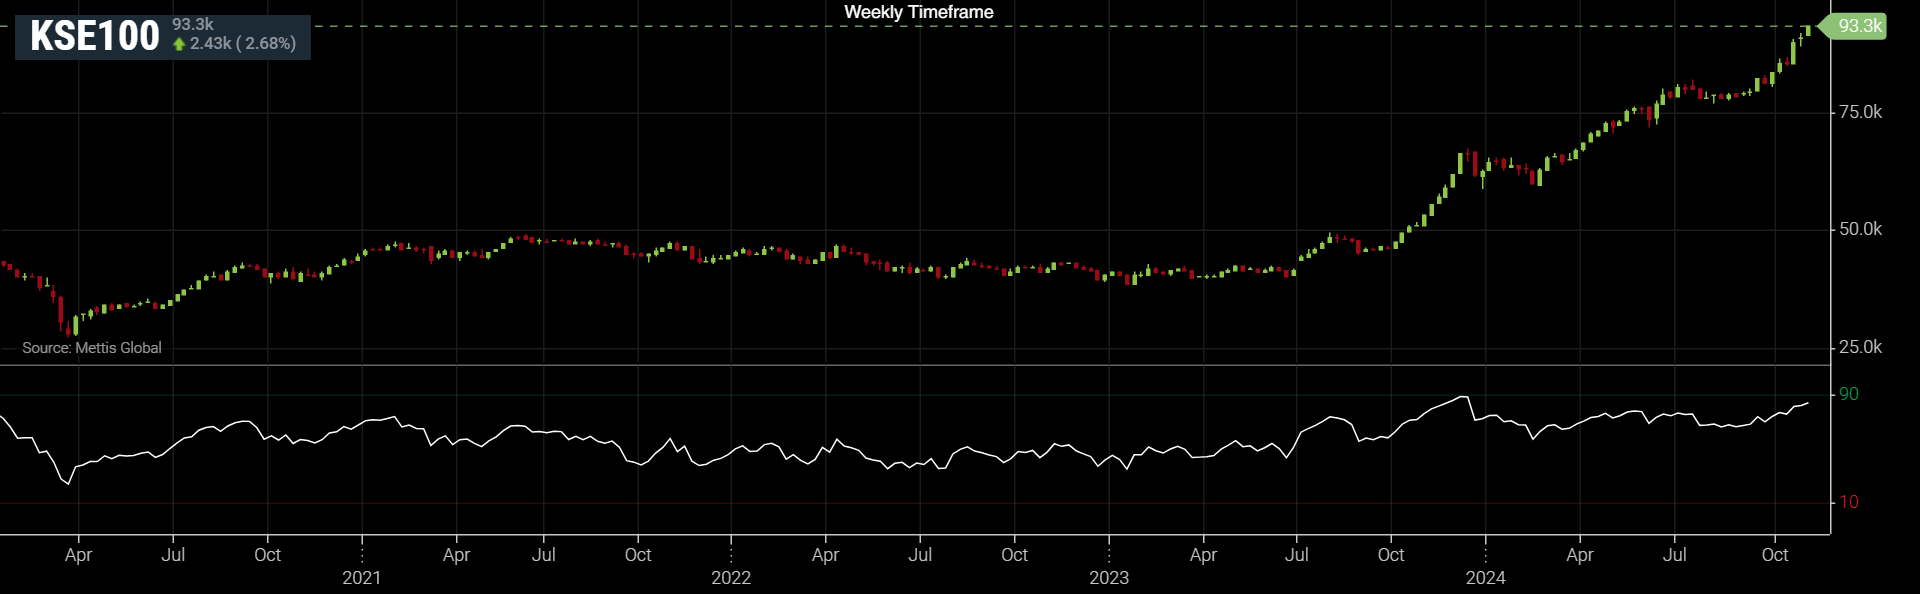
The equity benchmark KSE-100 Index has surged 30,841 points or 49.4% so far this year. With that its weekly relative strength index (RSI), a widely tracked measure of momentum, has risen to about 85 points.
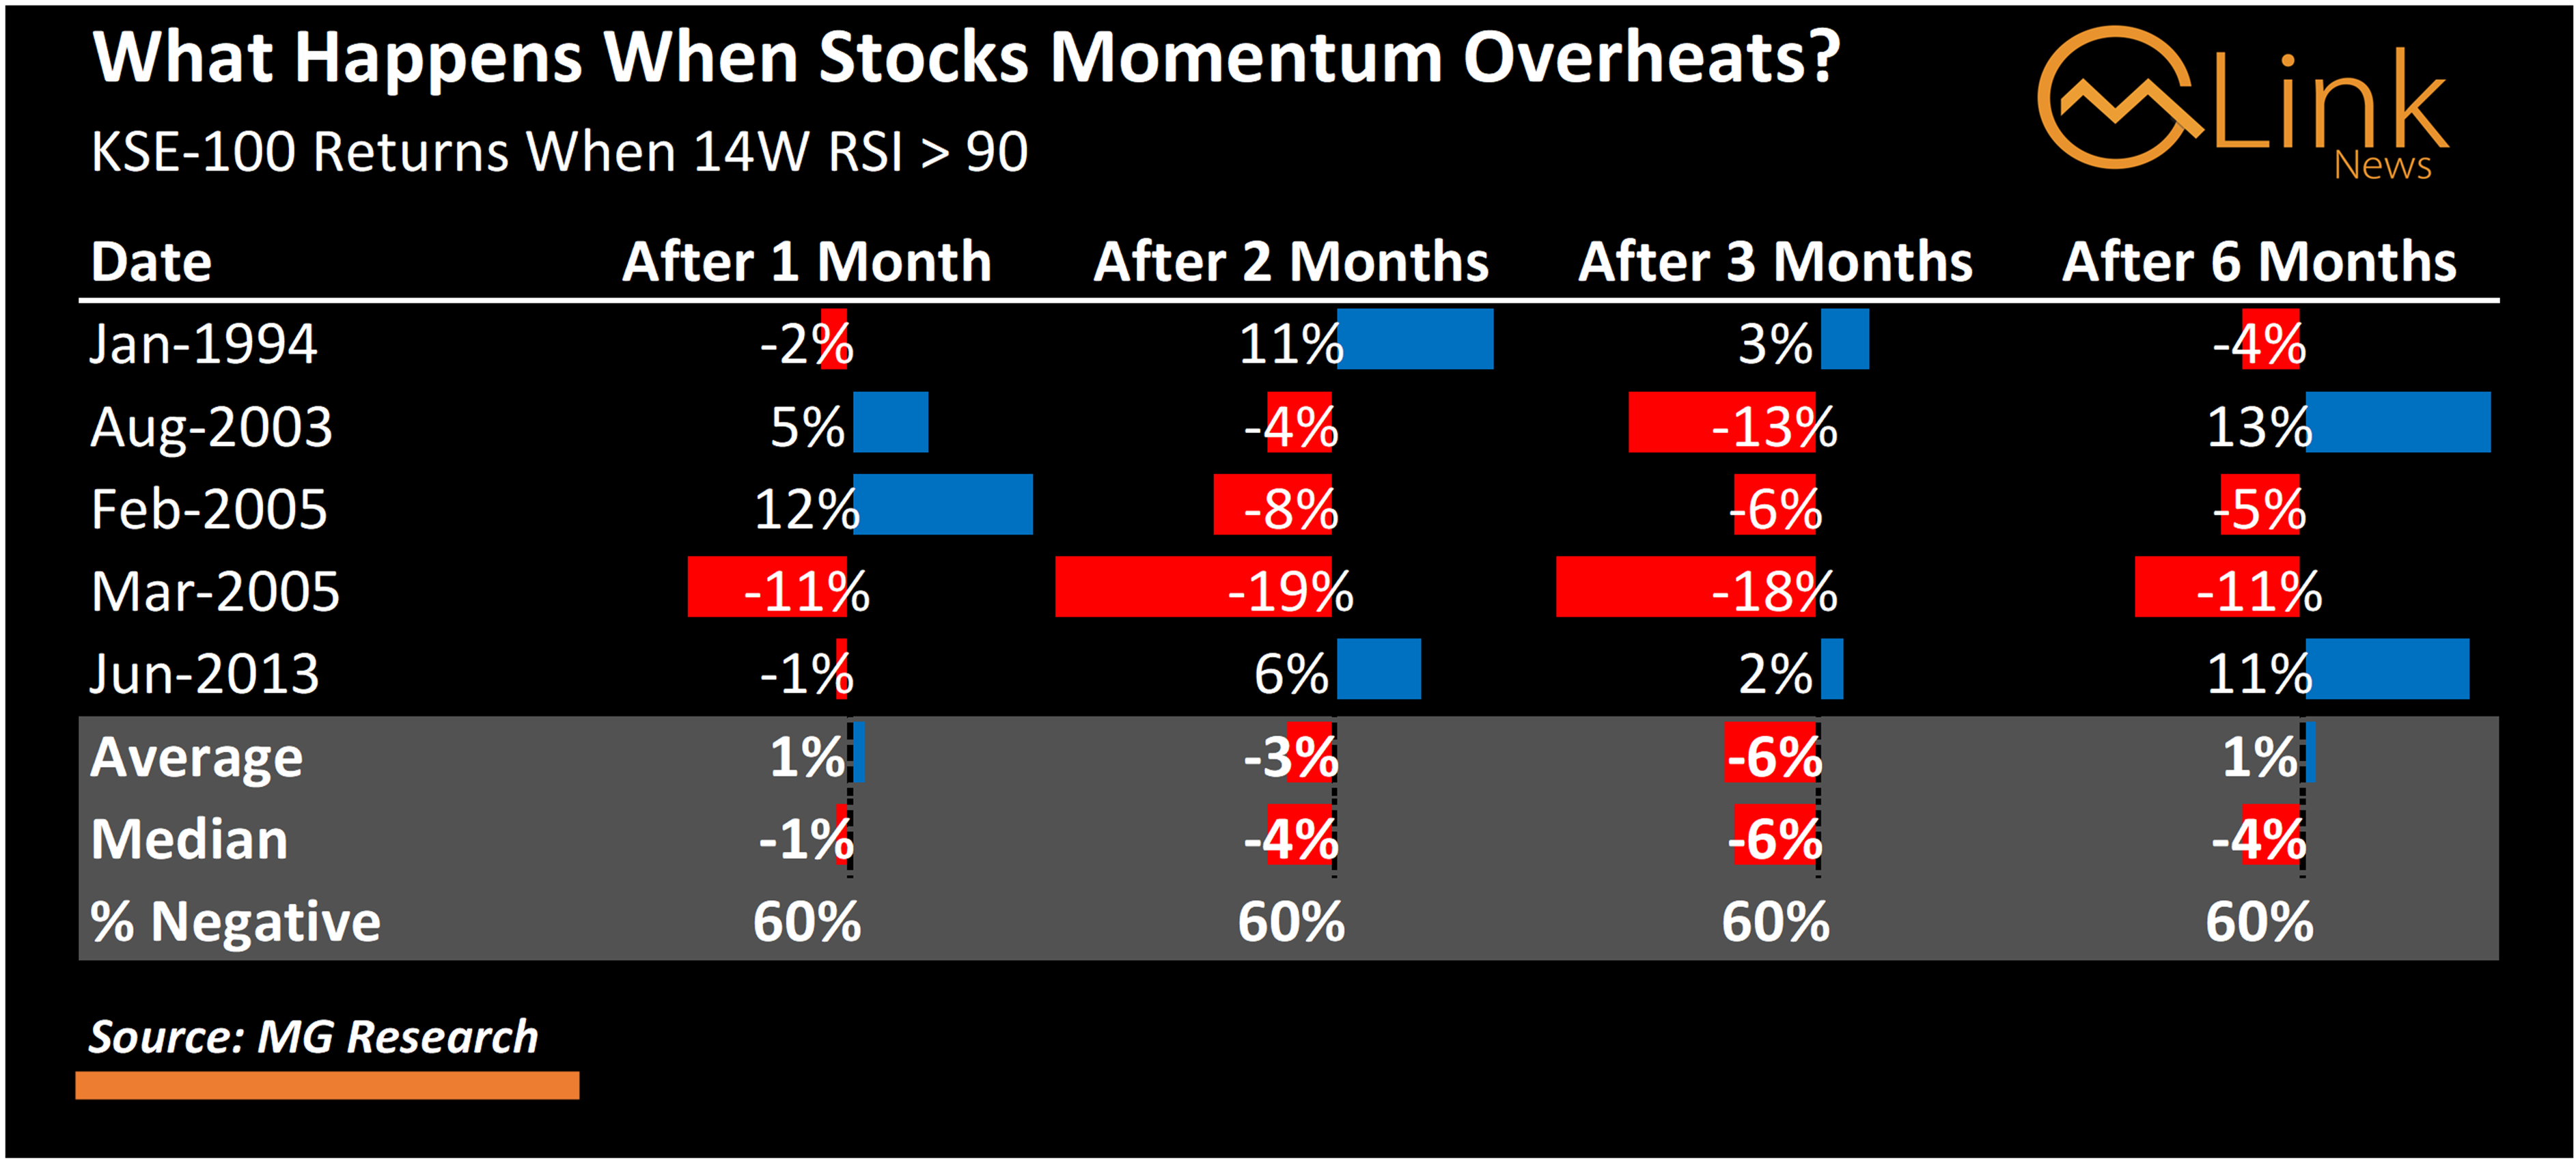
That is close to the historic extreme of 90 points that has predicted previous selloffs.
In the previous five instances when the metric crossed above 90, the index fell an average 6% over the next three months, data compiled by MG Research show.
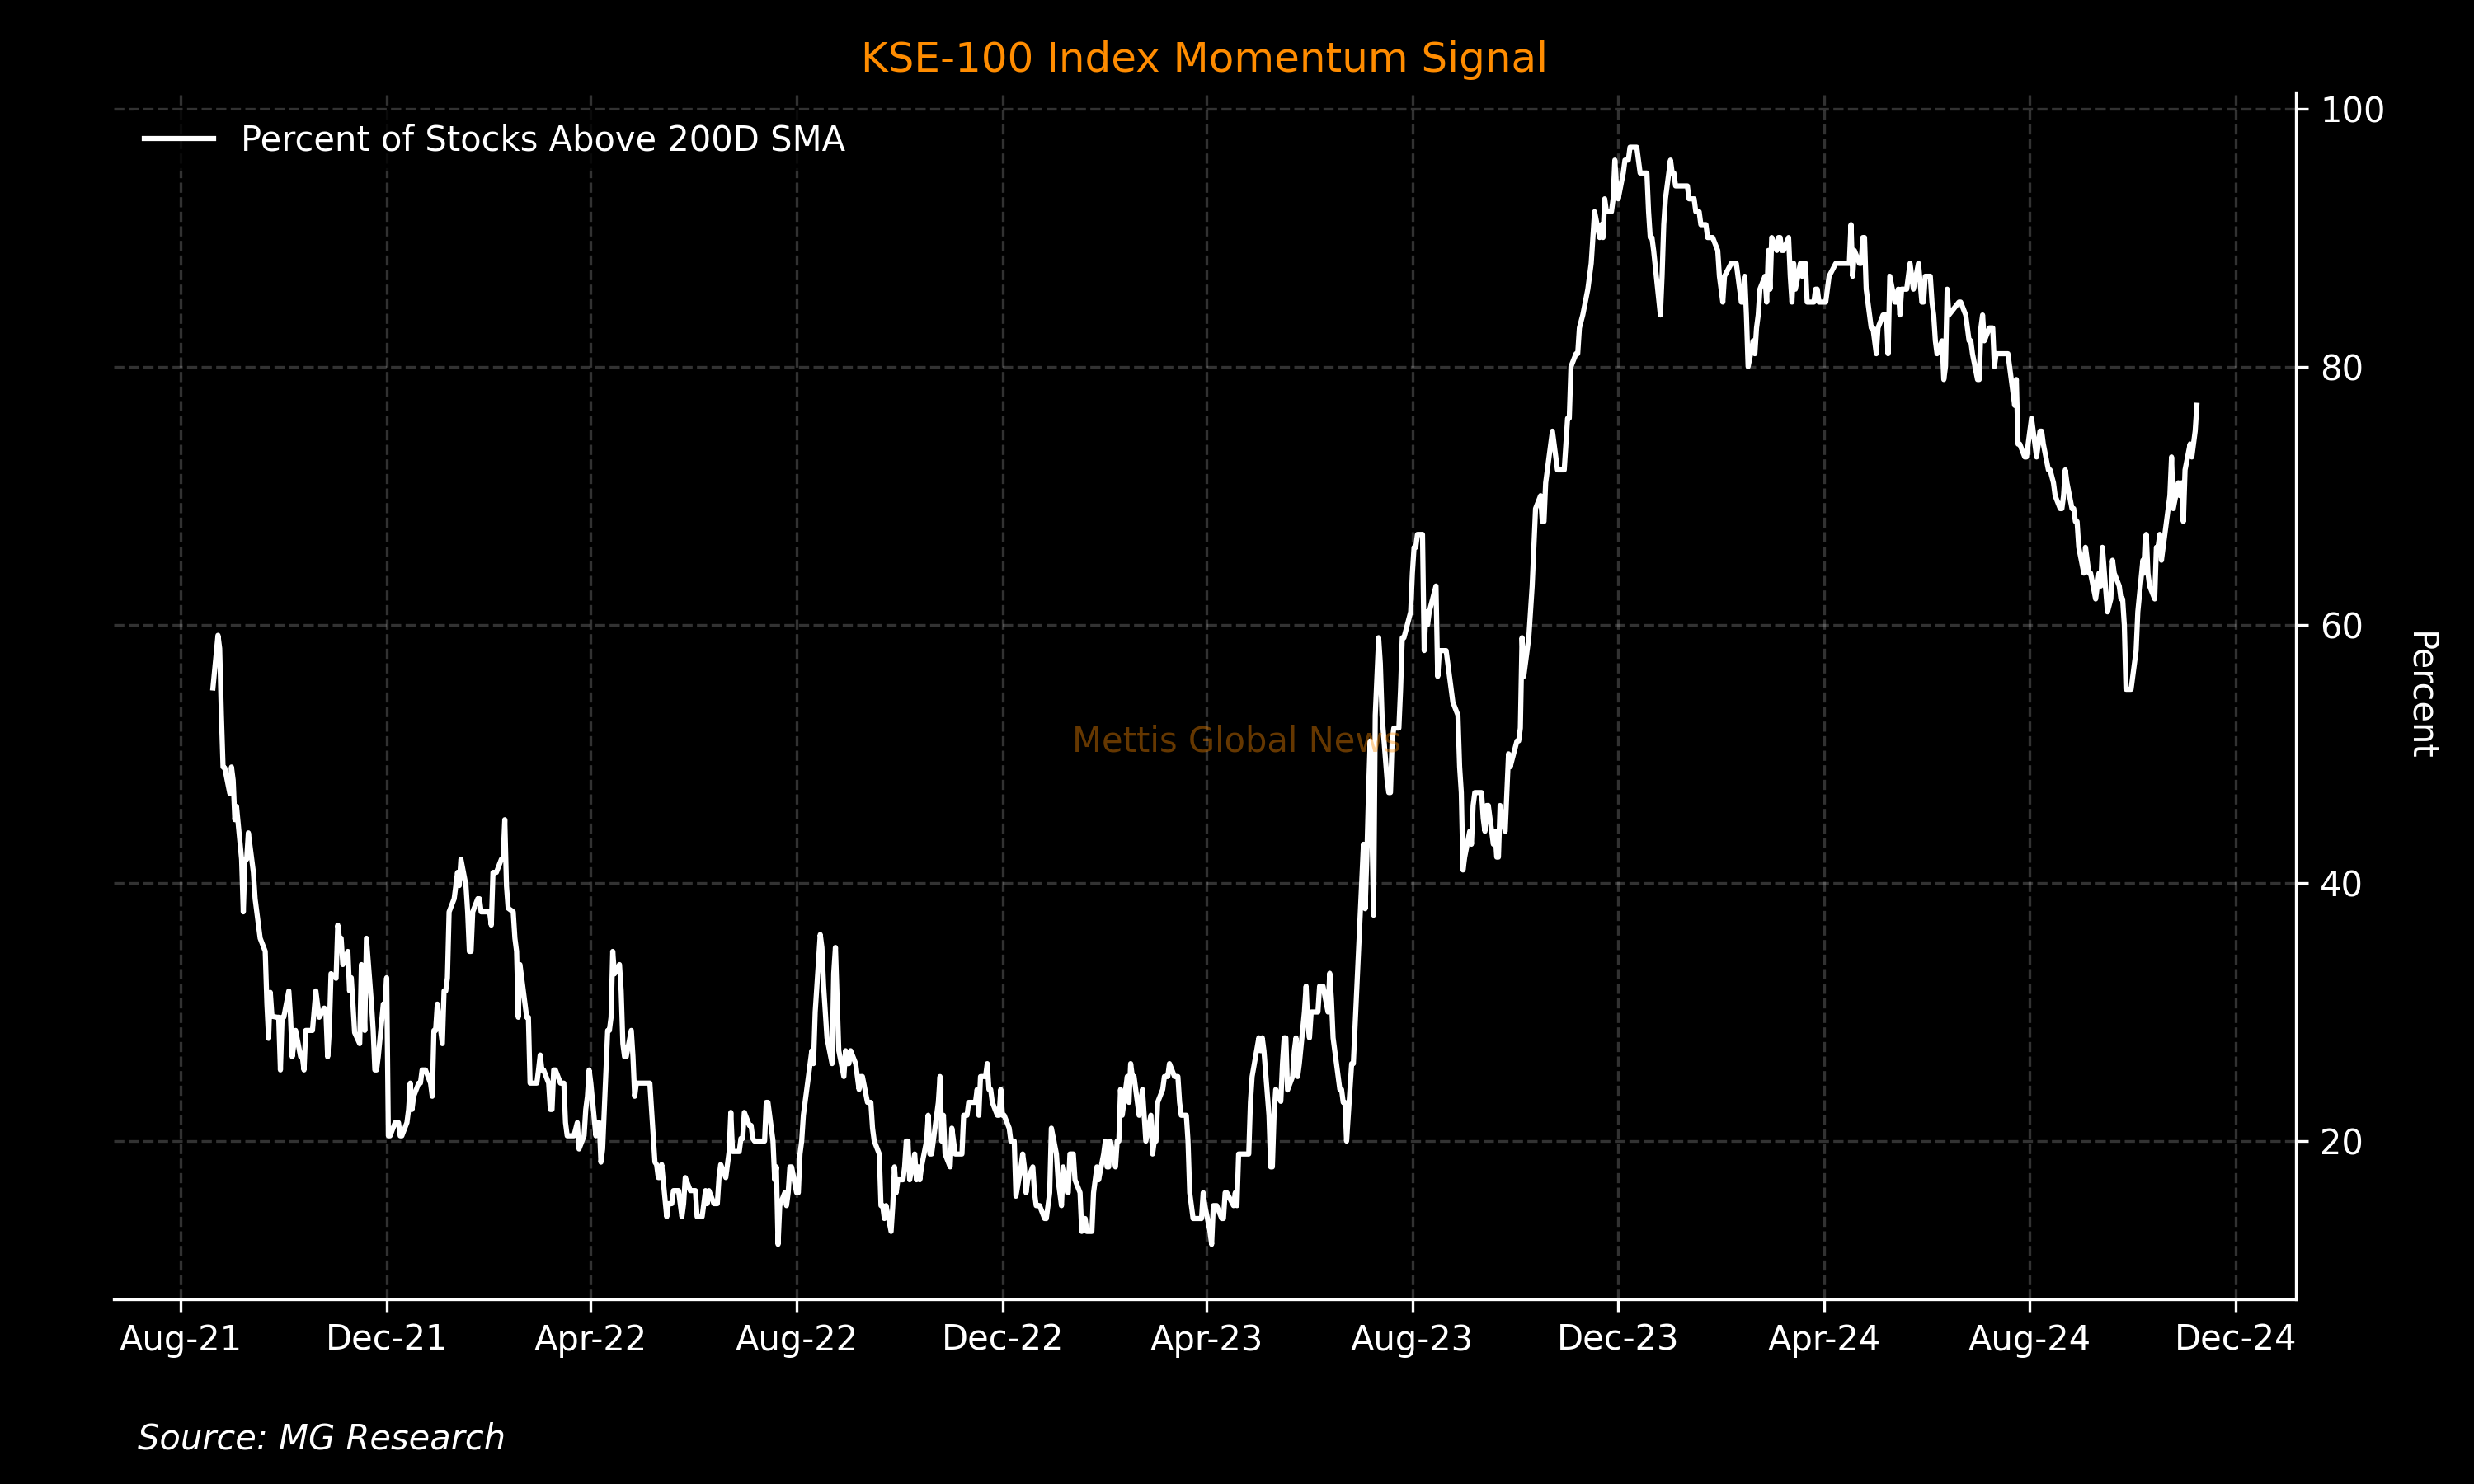
Another breadth and momentum indictor shows KSE-100’s gains are broadening beyond its biggest members, as 77% of the index’s stocks traded above their 200-day moving average on Friday.
On a shorter-term basis, KSE-100's support level stands at around 92,734, based on pivot points. Meanwhile, the technical indicator suggests an initial resistance level at 93,682, with further barriers at 94,072 and 94,630.
The index closed 1.2% below the upper limit of its 20-day Bollinger band and 11.6% above the lower limit. The gap between the upper and lower Bollinger of KSE-100 Index has widened further by 27.5% compared to last week.
Disclaimer: The views and analysis in this article are the opinions of the author and are for informational purposes only. It is not intended to be financial or investment advice and should not be the basis for making financial decisions.
Copyright Mettis Link News
Related News


| Name | Price/Vol | %Chg/NChg |
|---|---|---|
| KSE100 | 175,285.78 248.39M | 1.02% 1766.97 |
| ALLSHR | 106,536.82 578.97M | 1.02% 1073.42 |
| KSE30 | 52,320.98 90.24M | 1.18% 611.36 |
| KMI30 | 246,775.63 72.73M | 0.99% 2407.71 |
| KMIALLSHR | 68,372.65 345.21M | 0.84% 569.39 |
| BKTi | 49,718.24 37.75M | 1.43% 700.72 |
| OGTi | 35,126.27 7.30M | 0.44% 154.29 |
| Symbol | Bid/Ask | High/Low |
|---|
| Name | Last | High/Low | Chg/%Chg |
|---|---|---|---|
| BITCOIN FUTURES | 65,190.00 | 65,740.00 64,585.00 | 475.00 0.73% |
| BRENT CRUDE | 85.88 | 86.55 83.32 | 1.15 1.36% |
| RICHARDS BAY COAL MONTHLY | 105.75 | 0.00 0.00 | -1.25 -1.17% |
| ROTTERDAM COAL MONTHLY | 120.00 | 120.00 120.00 | 0.65 0.54% |
| USD RBD PALM OLEIN | 1,135.00 | 1,135.00 1,135.00 | 0.00 0.00% |
| CRUDE OIL - WTI | 80.38 | 80.93 78.19 | 1.04 1.31% |
| SUGAR #11 WORLD | 14.86 | 14.99 14.71 | -0.02 -0.13% |
Chart of the Day
Latest News
Top 5 things to watch in this week
Pakistan Stock Movers
| Name | Last | Chg/%Chg |
|---|
| Name | Last | Chg/%Chg |
|---|