Weekly Market Roundup
_20260516095302187_fa0ba0.jpeg?width=950&height=450&format=Webp)
MG News | May 16, 2026 at 03:02 PM GMT+05:00

May 16, 2026 (MLN): Pakistan’s equity market
witnessed a sharp correction during the week ended May 15, 2026, with the
benchmark KSE-100 Index closing at 165,596.07, significantly lower than
171,115.82 recorded on May 08, 2026.
The index declined by 5,519.74 points, translating into a
3.23% week-on-week (WoW) loss, as investors stayed largely cautious and refrained from active participation due to rising oil prices and ongoing geopolitical uncertainties.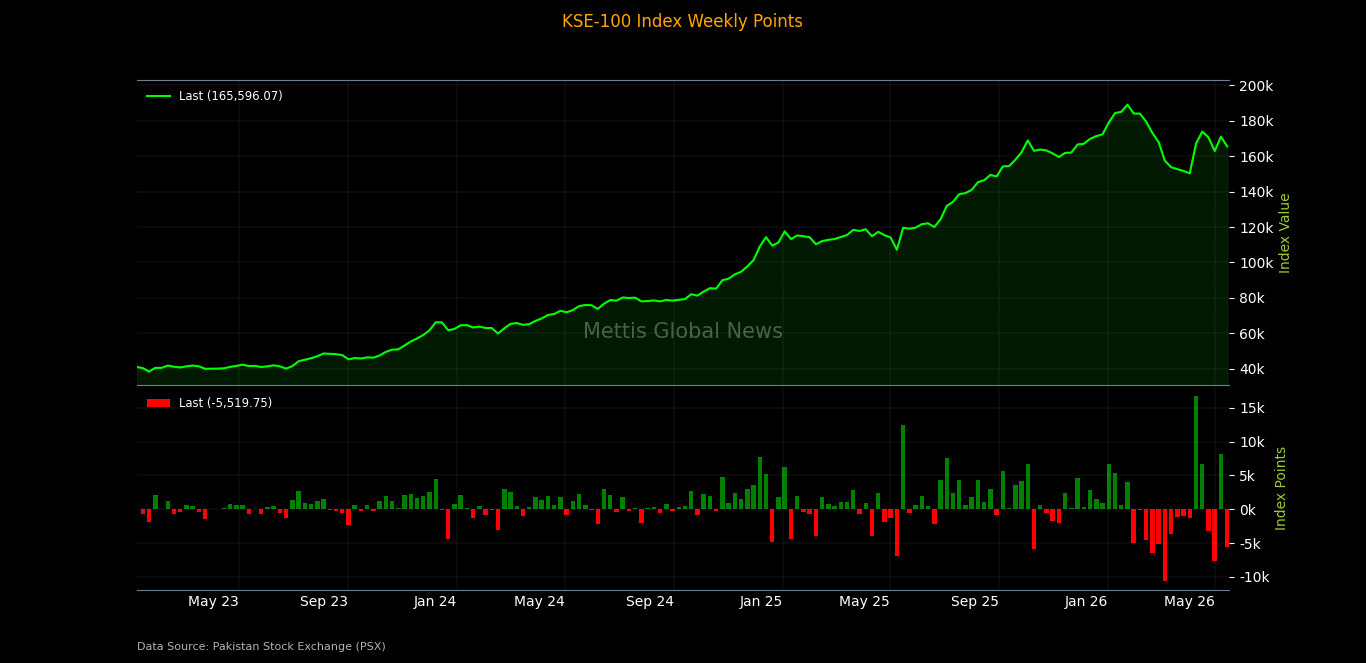
Market Capitalization
Total market capitalization declined in line with the
benchmark index performance. As of May 15, 2026, market capitalization stood at
Rs4.737 trillion, compared to Rs4.906tr on May 08, 2026, marking a decrease of
Rs168.60bn or 3.44% WoW.
In USD terms, market capitalization fell to $17.00bn from
$17.60bn in the previous week, reflecting erosion in overall market value amid
broad-based selling pressure.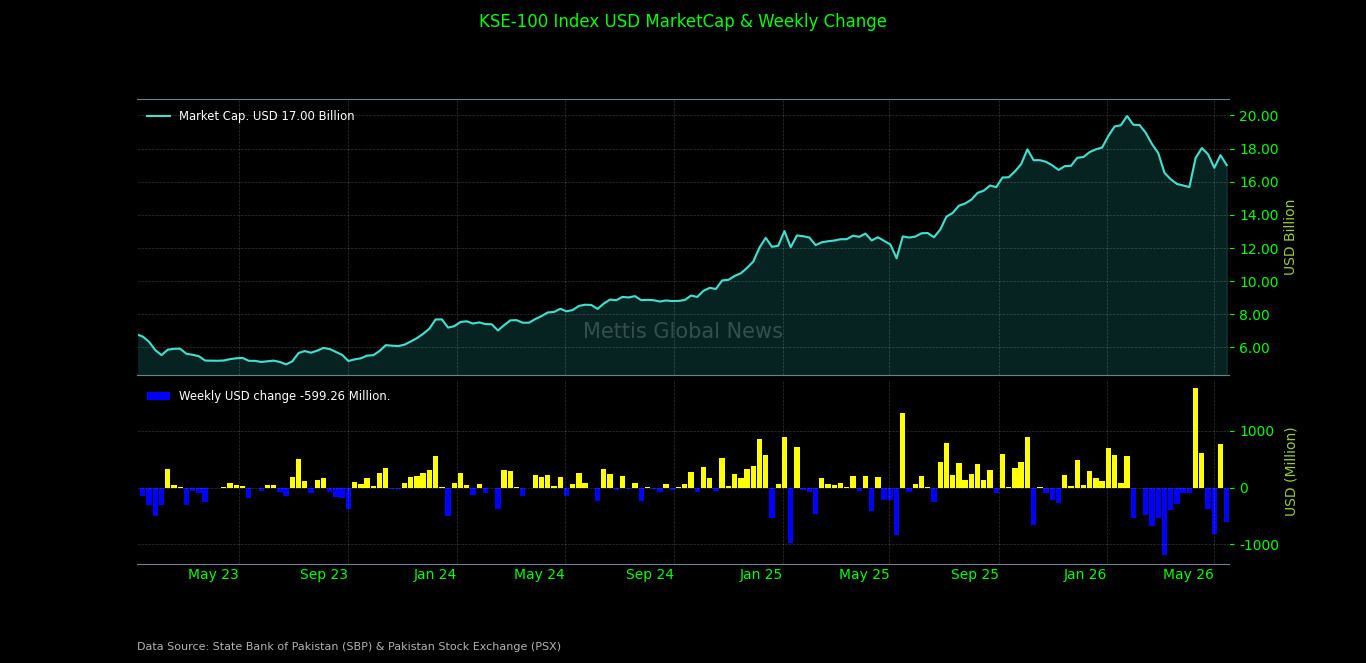
Dollar-adjusted returns also turned negative, clocking in at
negative 3.19% WoW, compared to positive 5.01% in the prior week, indicating
weakening investor returns in both local and foreign currency terms._20260516095247911_3fb445.jpeg)
On the macroeconomic front, Pakistan’s National Savings
Schemes recorded net
inflows of Rs22.88bn in March 2026, up 10.6% from February, signaling
continued recovery in saver confidence amid improving returns.
Pakistan’s external debt and liabilities stood
at $137.56bn by the end of Q3FY26, declining 0.34% QoQ but rising 5.73%
YoY, according to State Bank of Pakistan data.
Pakistan’s central government debt
rose 9.28% YoY to Rs80.52tr in March 2026, driven by higher domestic and
external borrowing to finance the fiscal deficit.
Pakistan’s auto sales more than doubled in April 2026, surging
106.9% YoY to 22,015 units, driven by strong demand across passenger cars,
SUVs, and tractors amid improving consumer confidence and economic activity.
Pakistan’s workers’ remittances fell
7.6% MoM to $3.54bn in April 2026 amid Middle East tensions, though inflows
remained 11.4% higher YoY, keeping cumulative 10MFY26 remittances at $33.86bn.
Index Movers
Sector-wise, the decline remained heavily concentrated in
index-heavy sectors.
Commercial banks emerged as the largest drag on the
benchmark index, wiping out 2,492.07 points amid heavy selling pressure in
major banking names and profit-taking across the sector.
Cement stocks trimmed 845.62 points from the index, while
investment banks/investment companies/securities companies erased 583.33 points
during the week.
Fertilizer dragged the benchmark by 409.62 points, followed
by power generation & distribution (-226.94 points), pharmaceuticals
(-184.87 points), oil & gas exploration companies (-172.65 points), and oil
& gas marketing companies (-162.38 points).
Additional negative contributions came from textile
composite (-110.26 points), insurance (-71.74 points), technology &
communication (-63.91 points), automobile assemblers (-44.22 points),
automobile parts & accessories (-43.27 points), cable & electrical
goods (-42.26 points), and property (-32.14 points), highlighting the
broad-based nature of the market decline.
Other lagging sectors included chemical (-30.44 points),
glass & ceramics (-27.96 points), transport (-16.01 points), tobacco
(-14.12 points), food & personal care products (-12.58 points), modarabas
(-8.92 points), engineering (-8.26 points),
synthetic & rayon (-5.61 points), refinery (-4.87
points), real estate investment trust (-1.86 points), textile weaving (-1.40
points), miscellaneous (-0.40 points), and vanaspati & allied industries
(-0.27 points).
On the positive side, only a handful of sectors managed to
close in green territory, with leather & tanneries adding 58.97 points,
followed by textile spinning (+20.52 points), paper, board & packaging
(+14.03 points),
close-end mutual fund (+2.78 points), sugar & allied
industries (+1.39 points), leasing companies (+0.40 points), and woollen (+0.16
points), indicating limited strength in selective pockets of the market.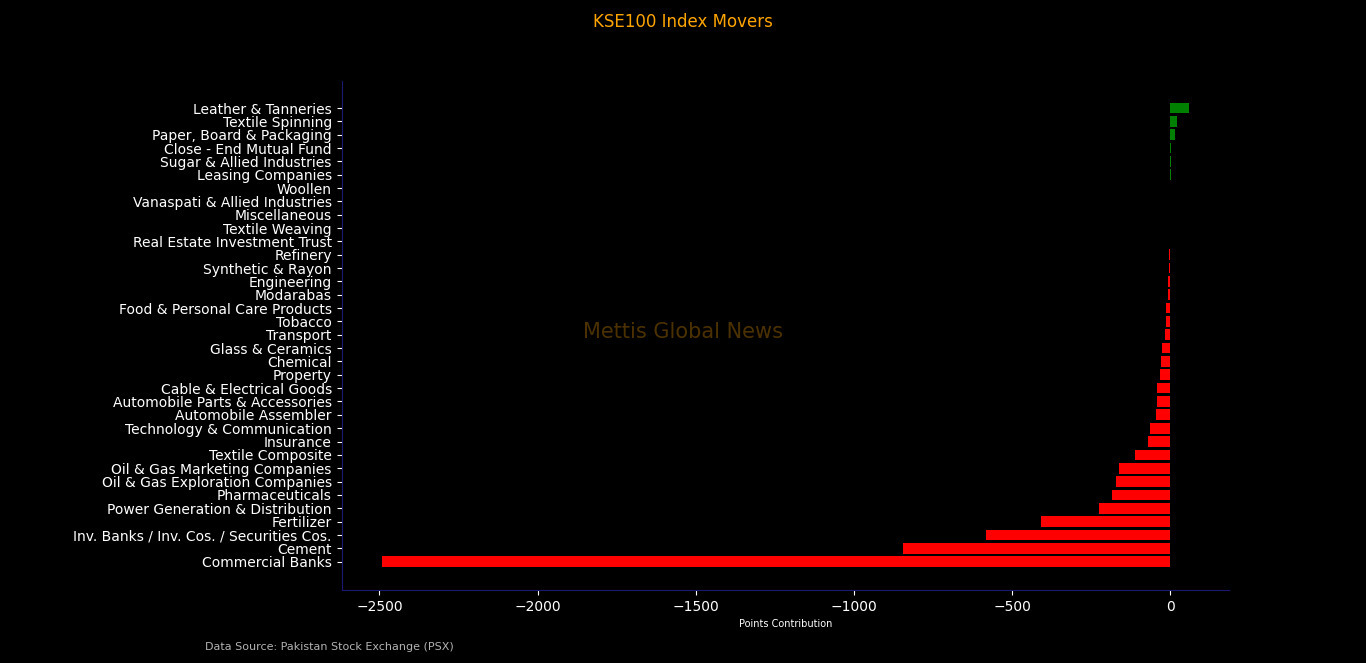
Scrip-wise, the downside was dominated by heavyweight
banking, cement, fertilizer, and investment company stocks.
United Bank Limited emerged as the largest negative
contributor, dragging the index by 1,094.31 points, followed by Engro Holdings
(-549.21 points), Habib Bank Limited (-418.61 points), Fauji Fertilizer Company
(-341.12 points), and Bank AL Habib (-295.76 points).
Other major laggards included National Bank of Pakistan
(-228.53 points), HUBCO (-228.17 points), Systems Limited (-135.05 points),
Bank of Punjab (-105.78 points),
Oil & Gas Development Company (-105.54 points), Meezan
Bank (-100.07 points), Pakistan State Oil (-88.85 points), DG Khan Cement
(-86.36 points), Maple Leaf Cement (-83.20 points), and MCB Bank (-82.48
points).
Additional pressure came from Adamjee Insurance, Askari
Bank, Fauji Cement, Mari Petroleum, Cherat Cement, Bank Alfalah, Kohat Cement,
The Searle Company, Nishat Mills, Thal Limited, Pak Elektron, GlaxoSmithKline
Pakistan,
Pakistan Telecommunication Company, Pakistan Stock Exchange,
and Lucky Cement, reflecting broad weakness across banking, cement, fertilizer,
technology, pharmaceutical, and energy sectors.
On the upside, gains remained limited and concentrated in a
handful of stocks.
TRG Pakistan led the gainers, contributing 98.11 points to
the index, followed by Service Industries (+58.97 points), K-Electric (+32.81
points), Sazgar Engineering Works (+21.23 points), and Gadoon Textile Mills
(+20.52 points).
Other positive contributors included Air Link Communication,
Cnergyico PK, Packages Limited, Pakistan Oilfields Limited, Nestlé Pakistan,
Pakistan Services Limited, FrieslandCampina Engro Pakistan, Atlas Honda, and
Rafhan Maize Products, reflecting selective buying interest in a few defensive
and growth-oriented names despite the broader market weakness.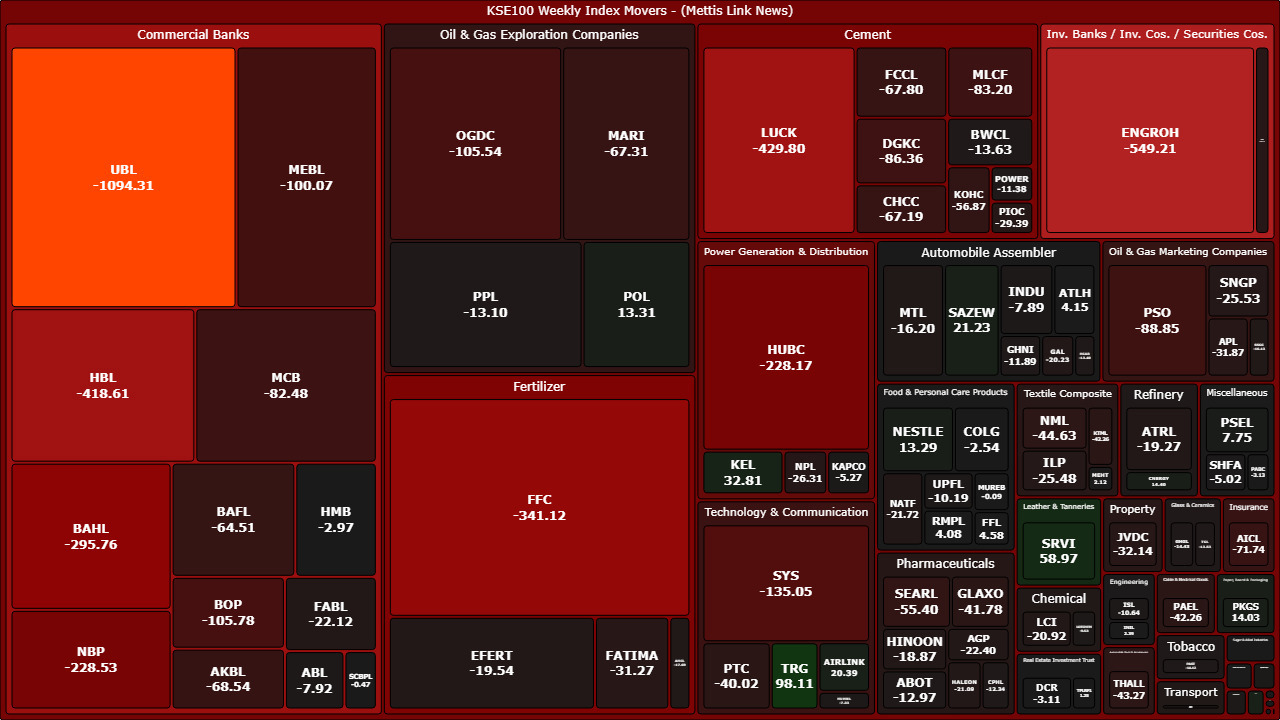
FIPI/LIPI
Foreign investors remained marginal net buyers during the
week, with total net foreign buying in the equity segment standing at Rs9.42
million ($33,768).
Within foreign flows, overseas Pakistanis recorded net
buying of Rs1.55bn ($5.54m), which was largely offset by net selling from
foreign corporates amounting to Rs1.51bn ($5.42m). Foreign individuals also
remained net sellers during the week.
On the local side, individuals emerged as the largest net
buyers with inflows of Rs3.96bn, followed by broker proprietary trading at
Rs298.66m and NBFCs at Rs57.46m.
Meanwhile, mutual funds remained the largest net sellers,
offloading equities worth Rs2.48bn, followed by companies with net selling of
Rs1.41bn. Insurance companies, banks/DFIs, and other organizations also
remained net sellers during the week._20260516095243973_6b559b.jpeg)
Copyright Mettis Link News
Related News


| Name | Price/Vol | %Chg/NChg |
|---|---|---|
| KSE100 | 179,306.41 279.49M | 0.91% 1613.49 |
| ALLSHR | 108,429.41 523.83M | 0.84% 902.02 |
| KSE30 | 53,456.60 100.55M | 0.82% 433.72 |
| KMI30 | 256,308.59 94.07M | 0.60% 1519.33 |
| KMIALLSHR | 70,487.96 354.79M | 0.79% 550.82 |
| BKTi | 48,585.18 22.55M | 1.29% 618.54 |
| OGTi | 37,017.30 4.03M | 0.50% 183.64 |
| Symbol | Bid/Ask | High/Low |
|---|
| Name | Last | High/Low | Chg/%Chg |
|---|---|---|---|
| BITCOIN FUTURES | 62,610.00 | 63,045.00 62,390.00 | 245.00 0.39% |
| BRENT CRUDE | 75.62 | 77.00 75.59 | -1.46 -1.89% |
| RICHARDS BAY COAL MONTHLY | 115.00 | 0.00 0.00 | 0.50 0.44% |
| ROTTERDAM COAL MONTHLY | 125.90 | 125.90 125.90 | -0.15 -0.12% |
| USD RBD PALM OLEIN | 1,157.50 | 1,157.50 1,157.50 | 0.00 0.00% |
| CRUDE OIL - WTI | 71.82 | 73.18 71.80 | -1.39 -1.90% |
| SUGAR #11 WORLD | 13.86 | 13.96 13.83 | -0.09 -0.65% |
Chart of the Day
Latest News
Top 5 things to watch in this week
Pakistan Stock Movers
| Name | Last | Chg/%Chg |
|---|
| Name | Last | Chg/%Chg |
|---|