Weekly Market Roundup

MG News | April 04, 2026 at 07:28 PM GMT+05:00

April 4, 2026 (MLN): Pakistan’s equity market
remained under pressure for the tenth consecutive week, as the benchmark
KSE-100 Index closed at 150,398.71 on 3 April 2026, down from 151,707.52
recorded on 27 March 2026. The index shed 1,308.81 points, translating
into a 0.86% week-on-week (WoW) decline.
Investor sentiment weakened due to rising US-Iran
tensions, which spurred fears of prolonged conflict and triggered oil
price spikes, creating uncertainty and broad-based selling in the market._20260404122931392_e75ac4.jpeg)
Market Capitalization
Total market capitalization declined in line with the
benchmark index. On 3 April 2026, market cap stood at Rs4.376 trillion,
compared to Rs4.403tr on 27 March 2026, marking a contraction of Rs27.98
billion or 0.64% WoW.
In USD terms, market capitalization fell to $15.68bn
from $15.77bn a week earlier. _20260404122910855_ce9641.jpeg)
Dollar-adjusted returns also deteriorated slightly, moving
from -0.6480% to -0.8376% WoW, showing a faster pace of decline on a
dollar basis._20260404122900144_197244.jpeg)
On the macroeconomic front, Pakistan’s
trade deficit narrowed to $2.73bn in March 2026, down 9.36% MoM due to a
sharper fall in imports.
However, the deficit widened on a yearly and cumulative
basis, highlighting persistent external sector pressures.
SBP raised Rs828.63bn
in its latest auction, with the bulk coming from Treasury Bills amid strong
demand, particularly in the 3-month tenor.
Pakistan’s
economy grew by 3.89% in Q2 FY26, driven by a strong rebound in the
industrial sector despite continued weakness in agriculture.
Pakistan’s CPI
inflation rose to 7.3% YoY in March 2026, with a sharp monthly acceleration
indicating broadening price pressures across the economy.
SBP
purchased $1.02bn from the interbank market in December 2025, nearly
doubling YoY and signaling strong inflows during the month.
However, cumulative FX purchases in 1HFY26 remained lower
than last year, indicating relatively softer inflow momentum overall.
Index Movers
Sector-wise, commercial banks emerged as the largest
positive contributor, adding 420.41 points to the benchmark, supported
by strong performances from MEBL, BAHL, HBL, and BAFL.
Oil and gas exploration companies added 134.31 points,
while refinery stocks contributed 140.55 points. Insurance and glass
& ceramics sectors provided marginal support, adding 21.61 and 24.11 points
respectively.
On the downside, investment banks, investment companies, and
securities companies were the biggest drag, wiping out 513.74 points,
followed closely by fertilizer (-512.77 points) and technology &
communication (-175.73 points).
Oil and gas marketing companies (-140.36 points), textile
composite (-102.52 points), and cement (-98.45 points) also contributed to the
decline.
Power generation & distribution (-71.81 points), leather
& tanneries (-62.66 points), cable & electrical goods (-59.31 points),
pharmaceuticals (-52.93 points), and food & personal care products (-41.30
points) added further pressure.
Other sectors such as automobile assemblers, engineering,
tobacco, paper & packaging, and miscellaneous also weighed on the index,
reflecting broad-based selling across the market.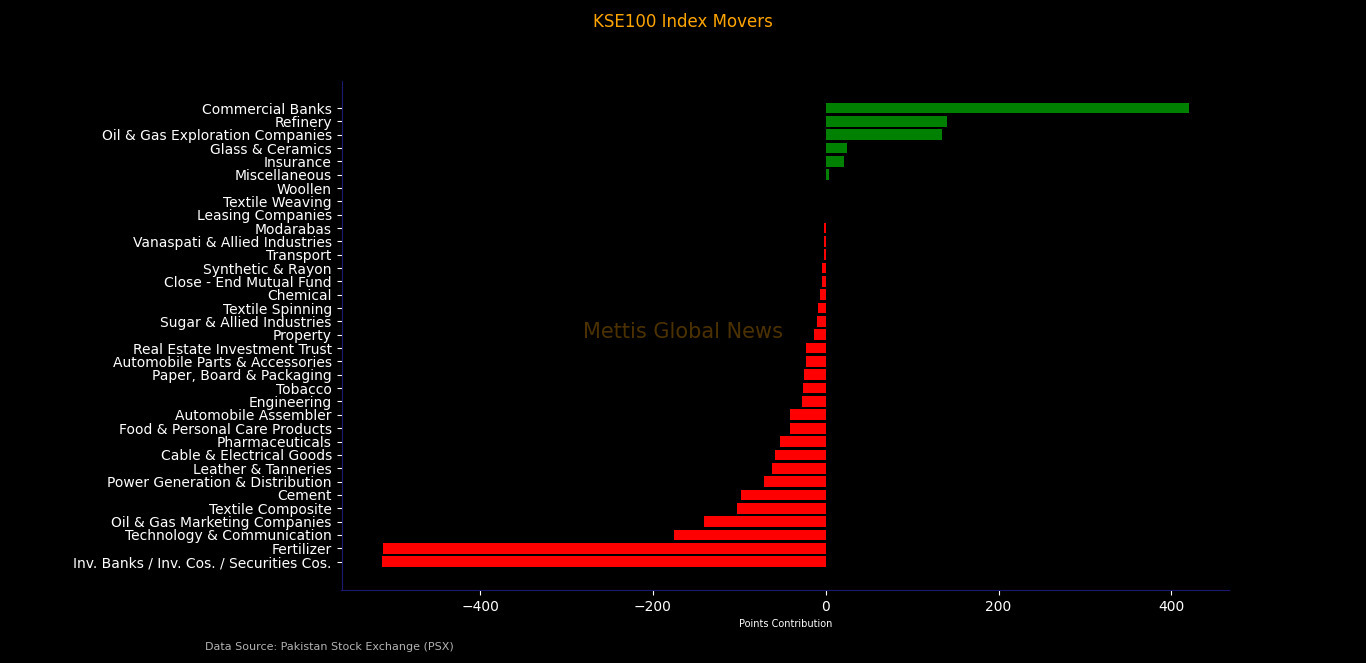
At the individual stock level, MEBL led the gainers, adding 307.78
points, followed by BAHL (+268.76 points) and HBL (+247.99 points).
Other notable contributors included BAFL (+157.33 points),
LUCK (+133.75 points), OGDC (+110.49 points), ATRL (+104.69 points), and TRG
(+90.63 points).
Additional support came from POL, HMB, MARI, CNERGY, ATLH,
FCCL, NBP, AICL, POWER, MCB, KEL, GHGL, SEARL, PSEL, AKBL, TGL, UPFL, GLAXO,
DCR, SSGC, MTL, AHCL, PABC, HCAR, MUREB, ABL, and BNWM.
Despite these gains, several large-cap stocks remained under
heavy selling pressure, keeping the benchmark subdued.
UBL emerged as the largest drag, erasing 533.88 points,
followed by ENGROH (-478.39 points), FFC (-363.12 points), SYS (-131.02
points), PSO (-116.34 points), MLCF (-94.69 points).
FATIMA (-87.27 points), PPL (-83.22 points), PTC (-81.74
points), HALEON (-20.67 points), KOHC (-18.94 points), NML (-19.54 points),
MEHT (-14.07 points), ILP (-28.49 points), and other index-heavy stocks,
highlighting persistent selling across major sectors.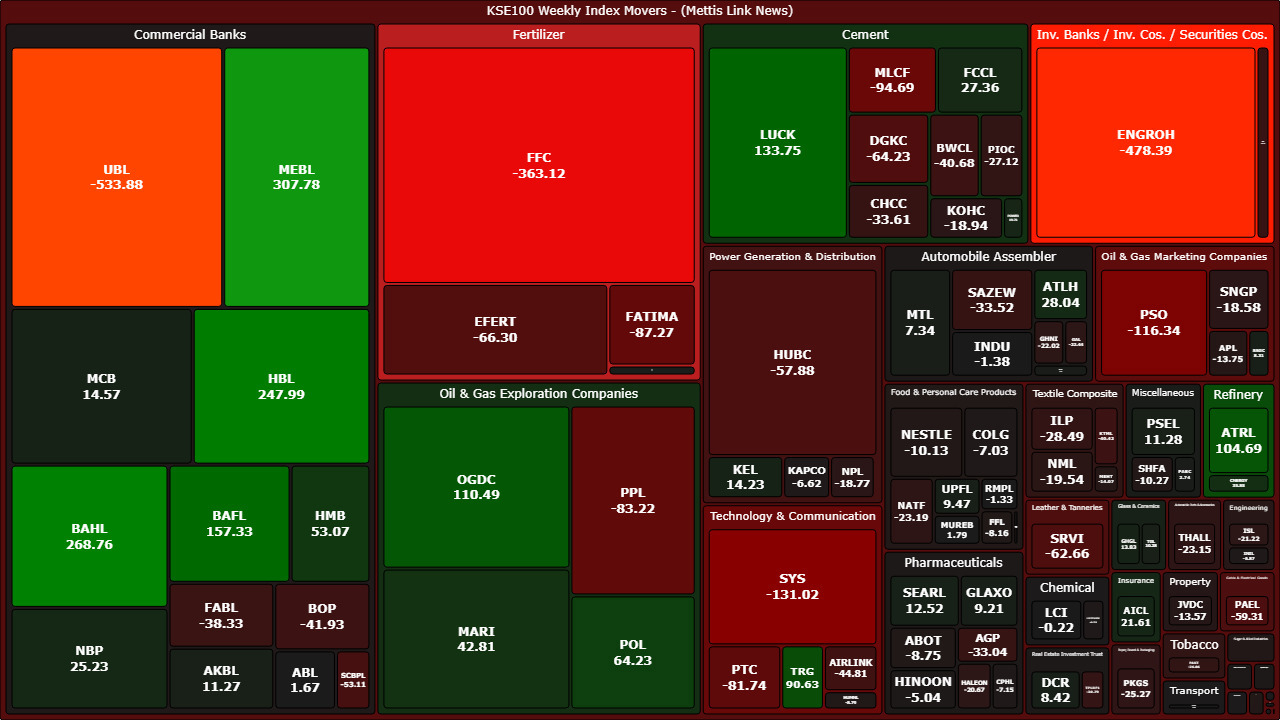
FIPI / LIPI
Foreign investment flows continued to weigh on the market.
Under Foreign Institutional Portfolio Investment (FIPI), foreign
investors remained net sellers with an outflow of Rs697.11m ($2.50m).
The majority of the selling came from foreign corporates,
which offloaded Rs806.46m, while overseas Pakistanis provided modest
support with net buying of Rs109.17m.
Foreign individuals remained largely neutral, contributing a
minor net inflow of Rs182,498.
Local investors absorbed the foreign outflow, resulting in a
matching net inflow of Rs697.11m ($2.50m) under Local Portfolio
Investment (LIPI).
Among local participants, individuals emerged as the largest
buyers with net purchases of Rs4.64bn, followed by broker proprietary
trading desks (+Rs786.95m) and insurance companies (+Rs492.74m).
Conversely, mutual funds (-Rs4.38bn), banks & DFIs (-Rs764.24m),
NBFCs (-Rs45.91m), and companies (-Rs165.87m) remained net sellers.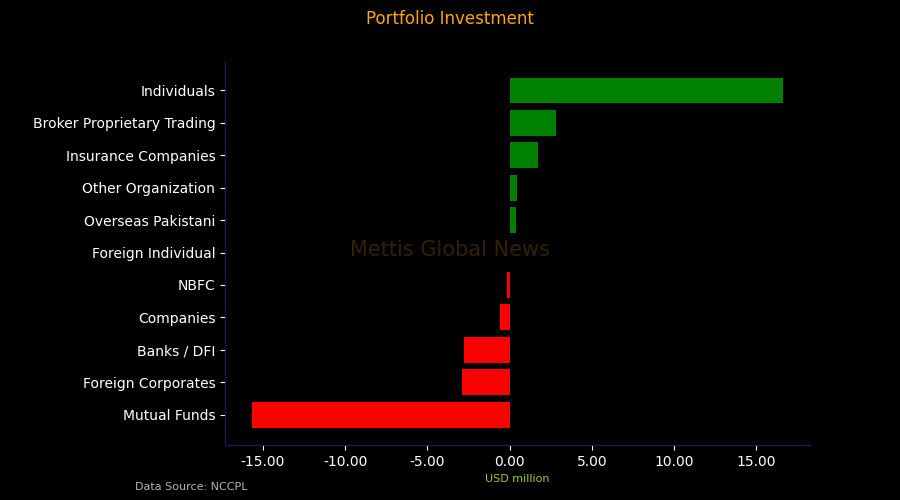
Copyright Mettis Link News
Related News

_20260529073616622_a5048c.jpeg?width=280&height=140&format=Webp)
_20260711124603464_8ff65f.jpeg?width=280&height=140&format=Webp)
| Name | Price/Vol | %Chg/NChg |
|---|---|---|
| KSE100 | 179,927.05 365.01M | -1.27% -2314.73 |
| ALLSHR | 109,270.69 838.76M | -1.19% -1312.98 |
| KSE30 | 53,705.71 89.34M | -1.33% -726.00 |
| KMI30 | 253,531.92 109.38M | -1.32% -3382.29 |
| KMIALLSHR | 70,152.63 543.97M | -1.25% -888.68 |
| BKTi | 50,997.50 18.73M | -1.38% -715.26 |
| OGTi | 36,216.08 8.18M | -1.21% -443.50 |
| Symbol | Bid/Ask | High/Low |
|---|
| Name | Last | High/Low | Chg/%Chg |
|---|---|---|---|
| BITCOIN FUTURES | 63,210.00 | 64,680.00 62,605.00 | -875.00 -1.37% |
| BRENT CRUDE | 78.44 | 79.80 77.28 | 2.43 3.20% |
| RICHARDS BAY COAL MONTHLY | 105.75 | 0.00 0.00 | -1.15 -1.08% |
| ROTTERDAM COAL MONTHLY | 118.00 | 0.00 0.00 | 0.65 0.55% |
| USD RBD PALM OLEIN | 1,135.00 | 1,135.00 1,135.00 | 0.00 0.00% |
| CRUDE OIL - WTI | 73.76 | 75.08 72.61 | 2.35 3.29% |
| SUGAR #11 WORLD | 14.71 | 14.98 14.65 | -0.17 -1.14% |
Chart of the Day
Latest News
Top 5 things to watch in this week
Pakistan Stock Movers
| Name | Last | Chg/%Chg |
|---|
| Name | Last | Chg/%Chg |
|---|